
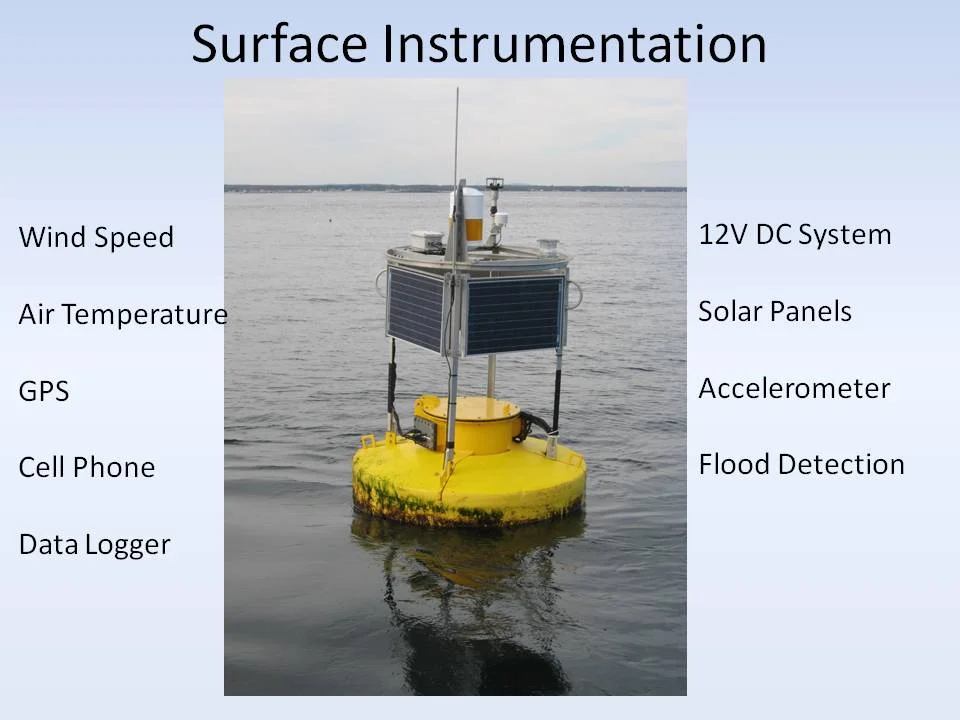
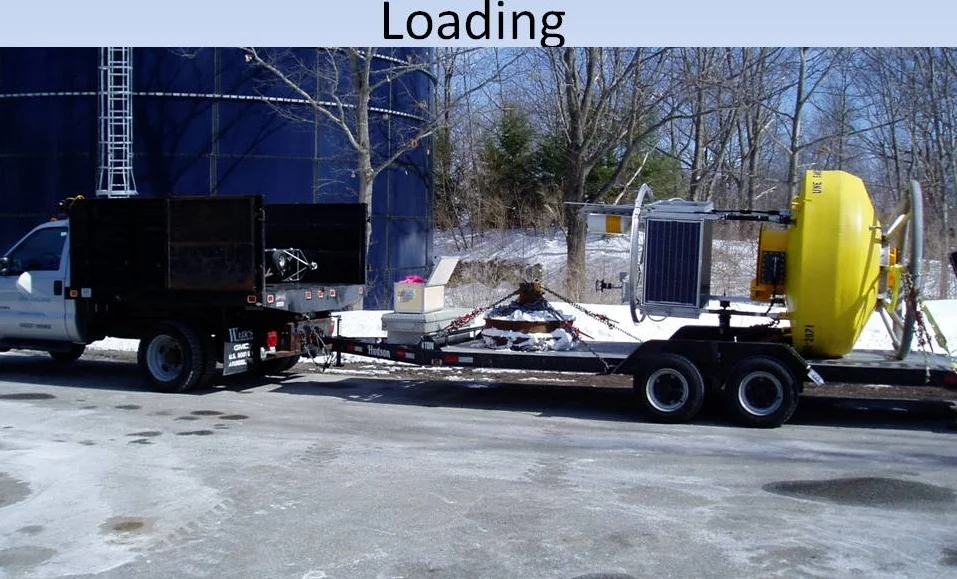
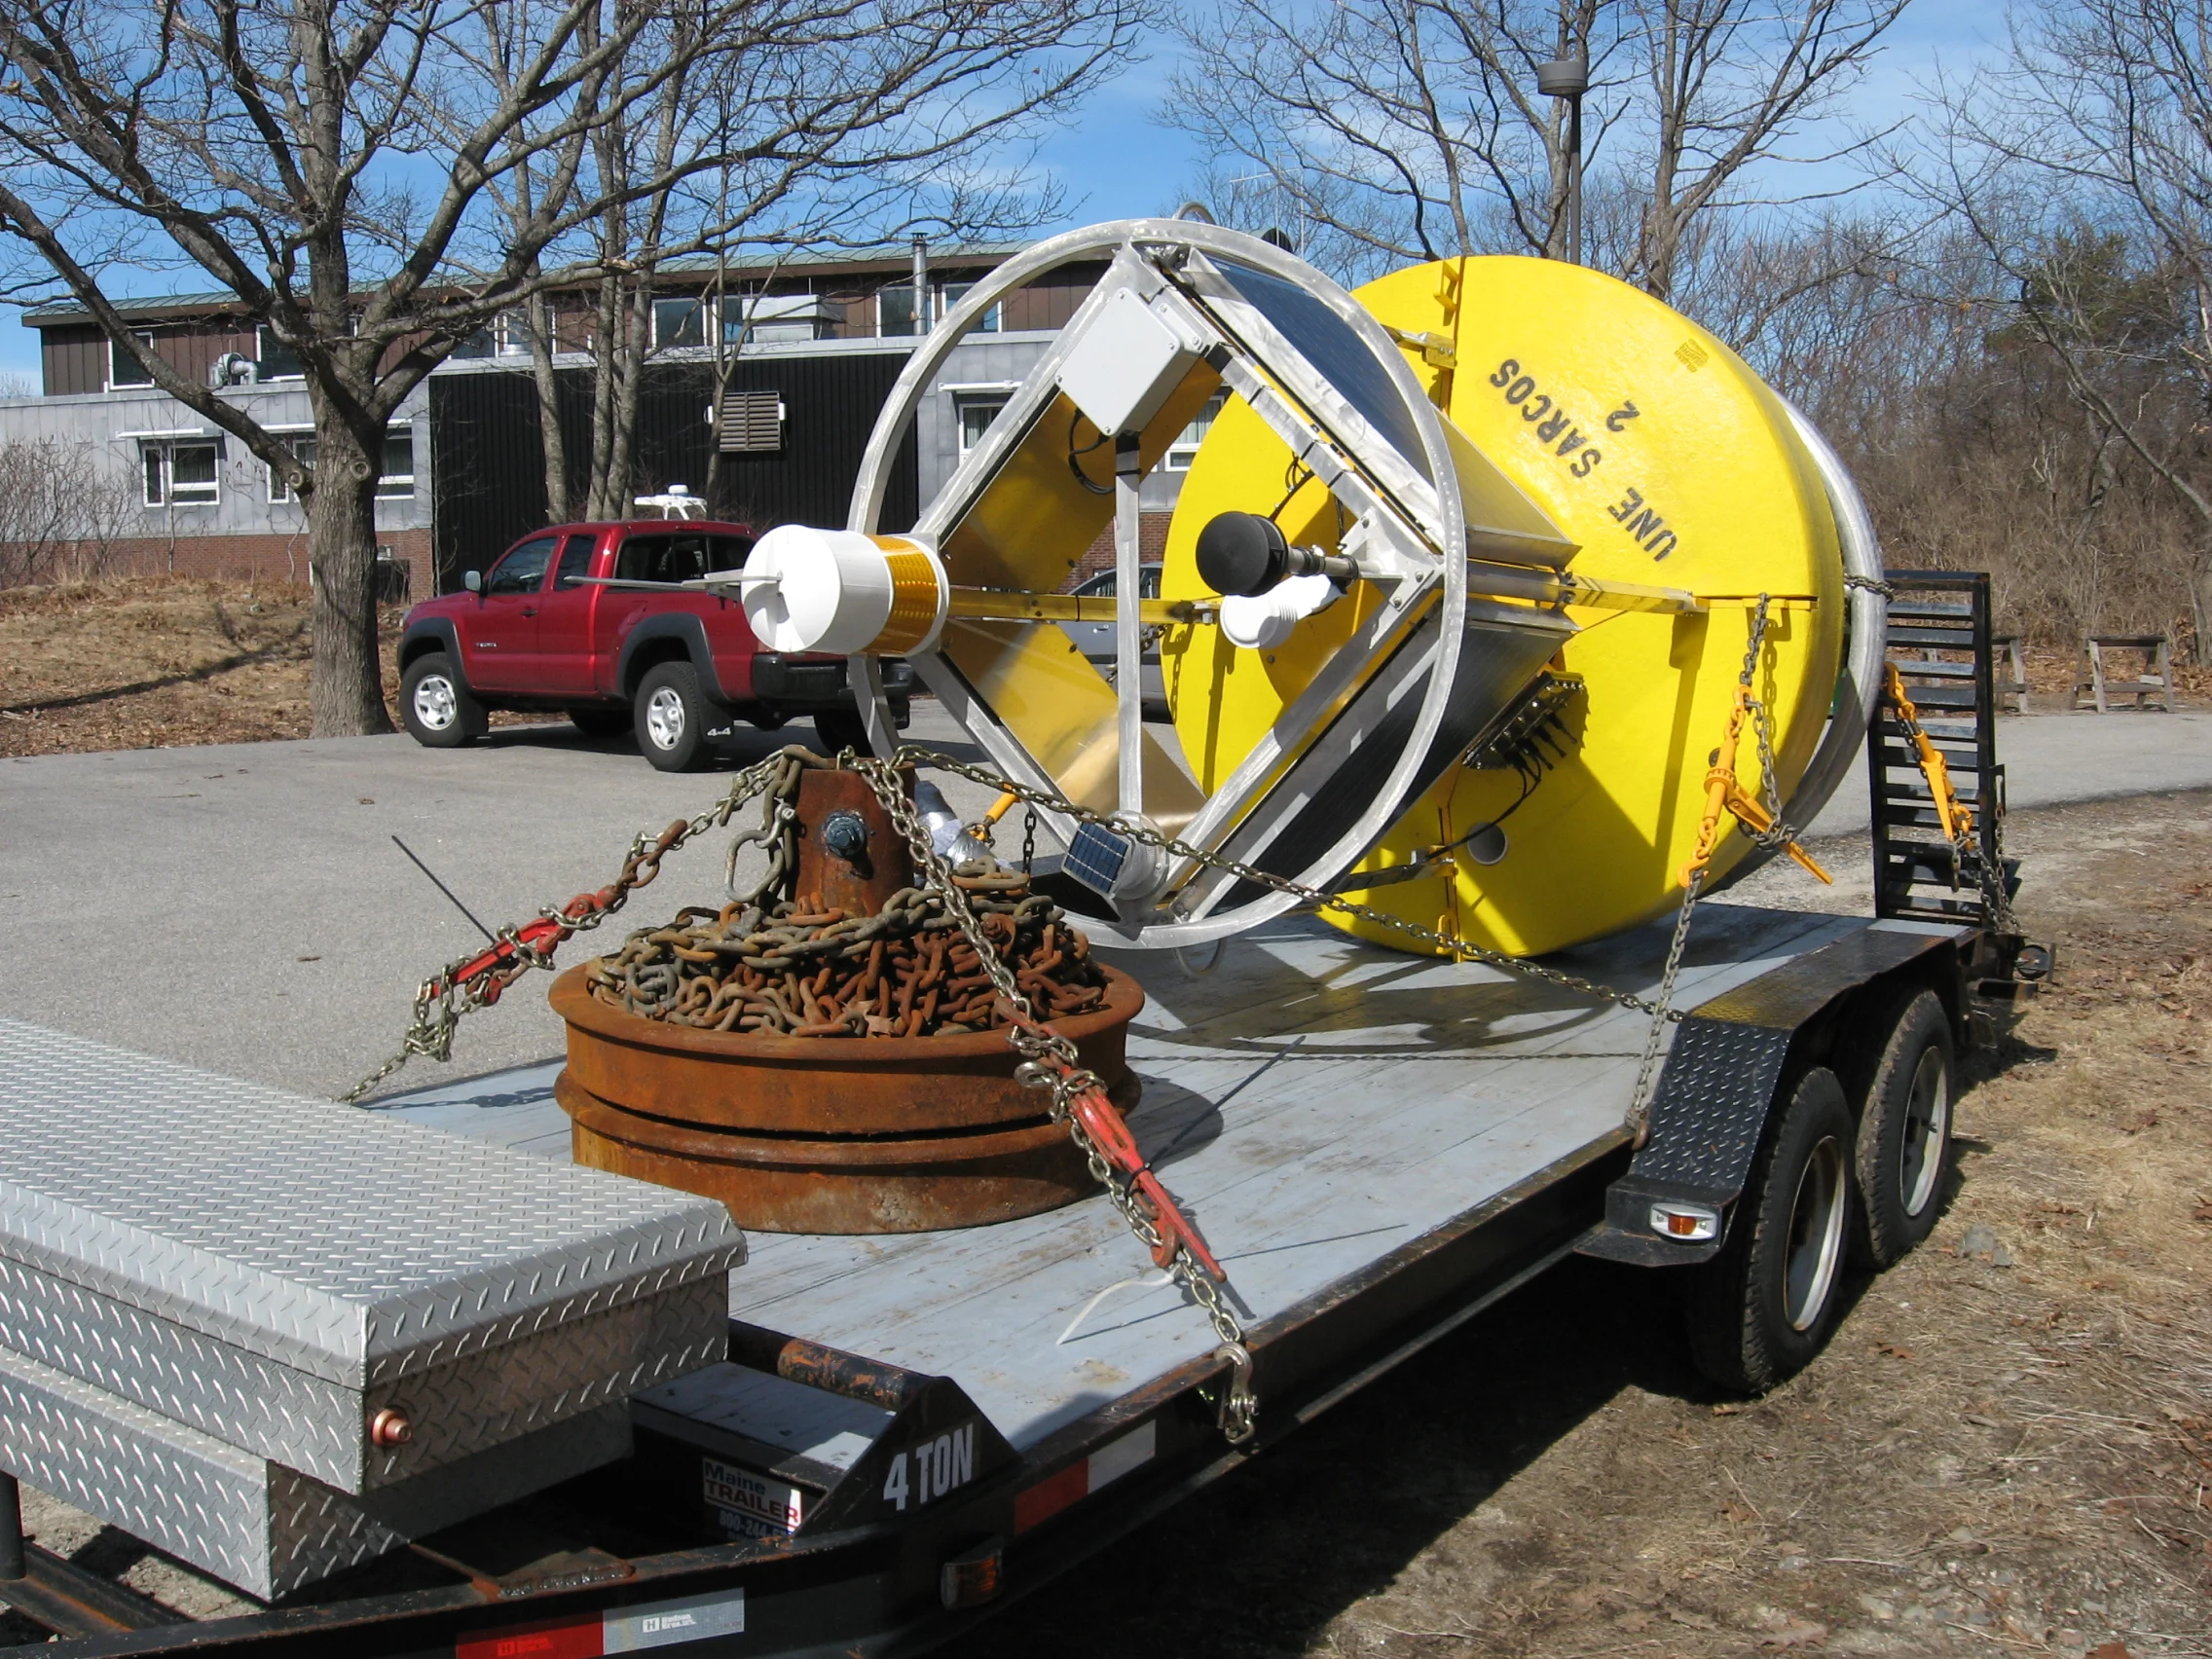
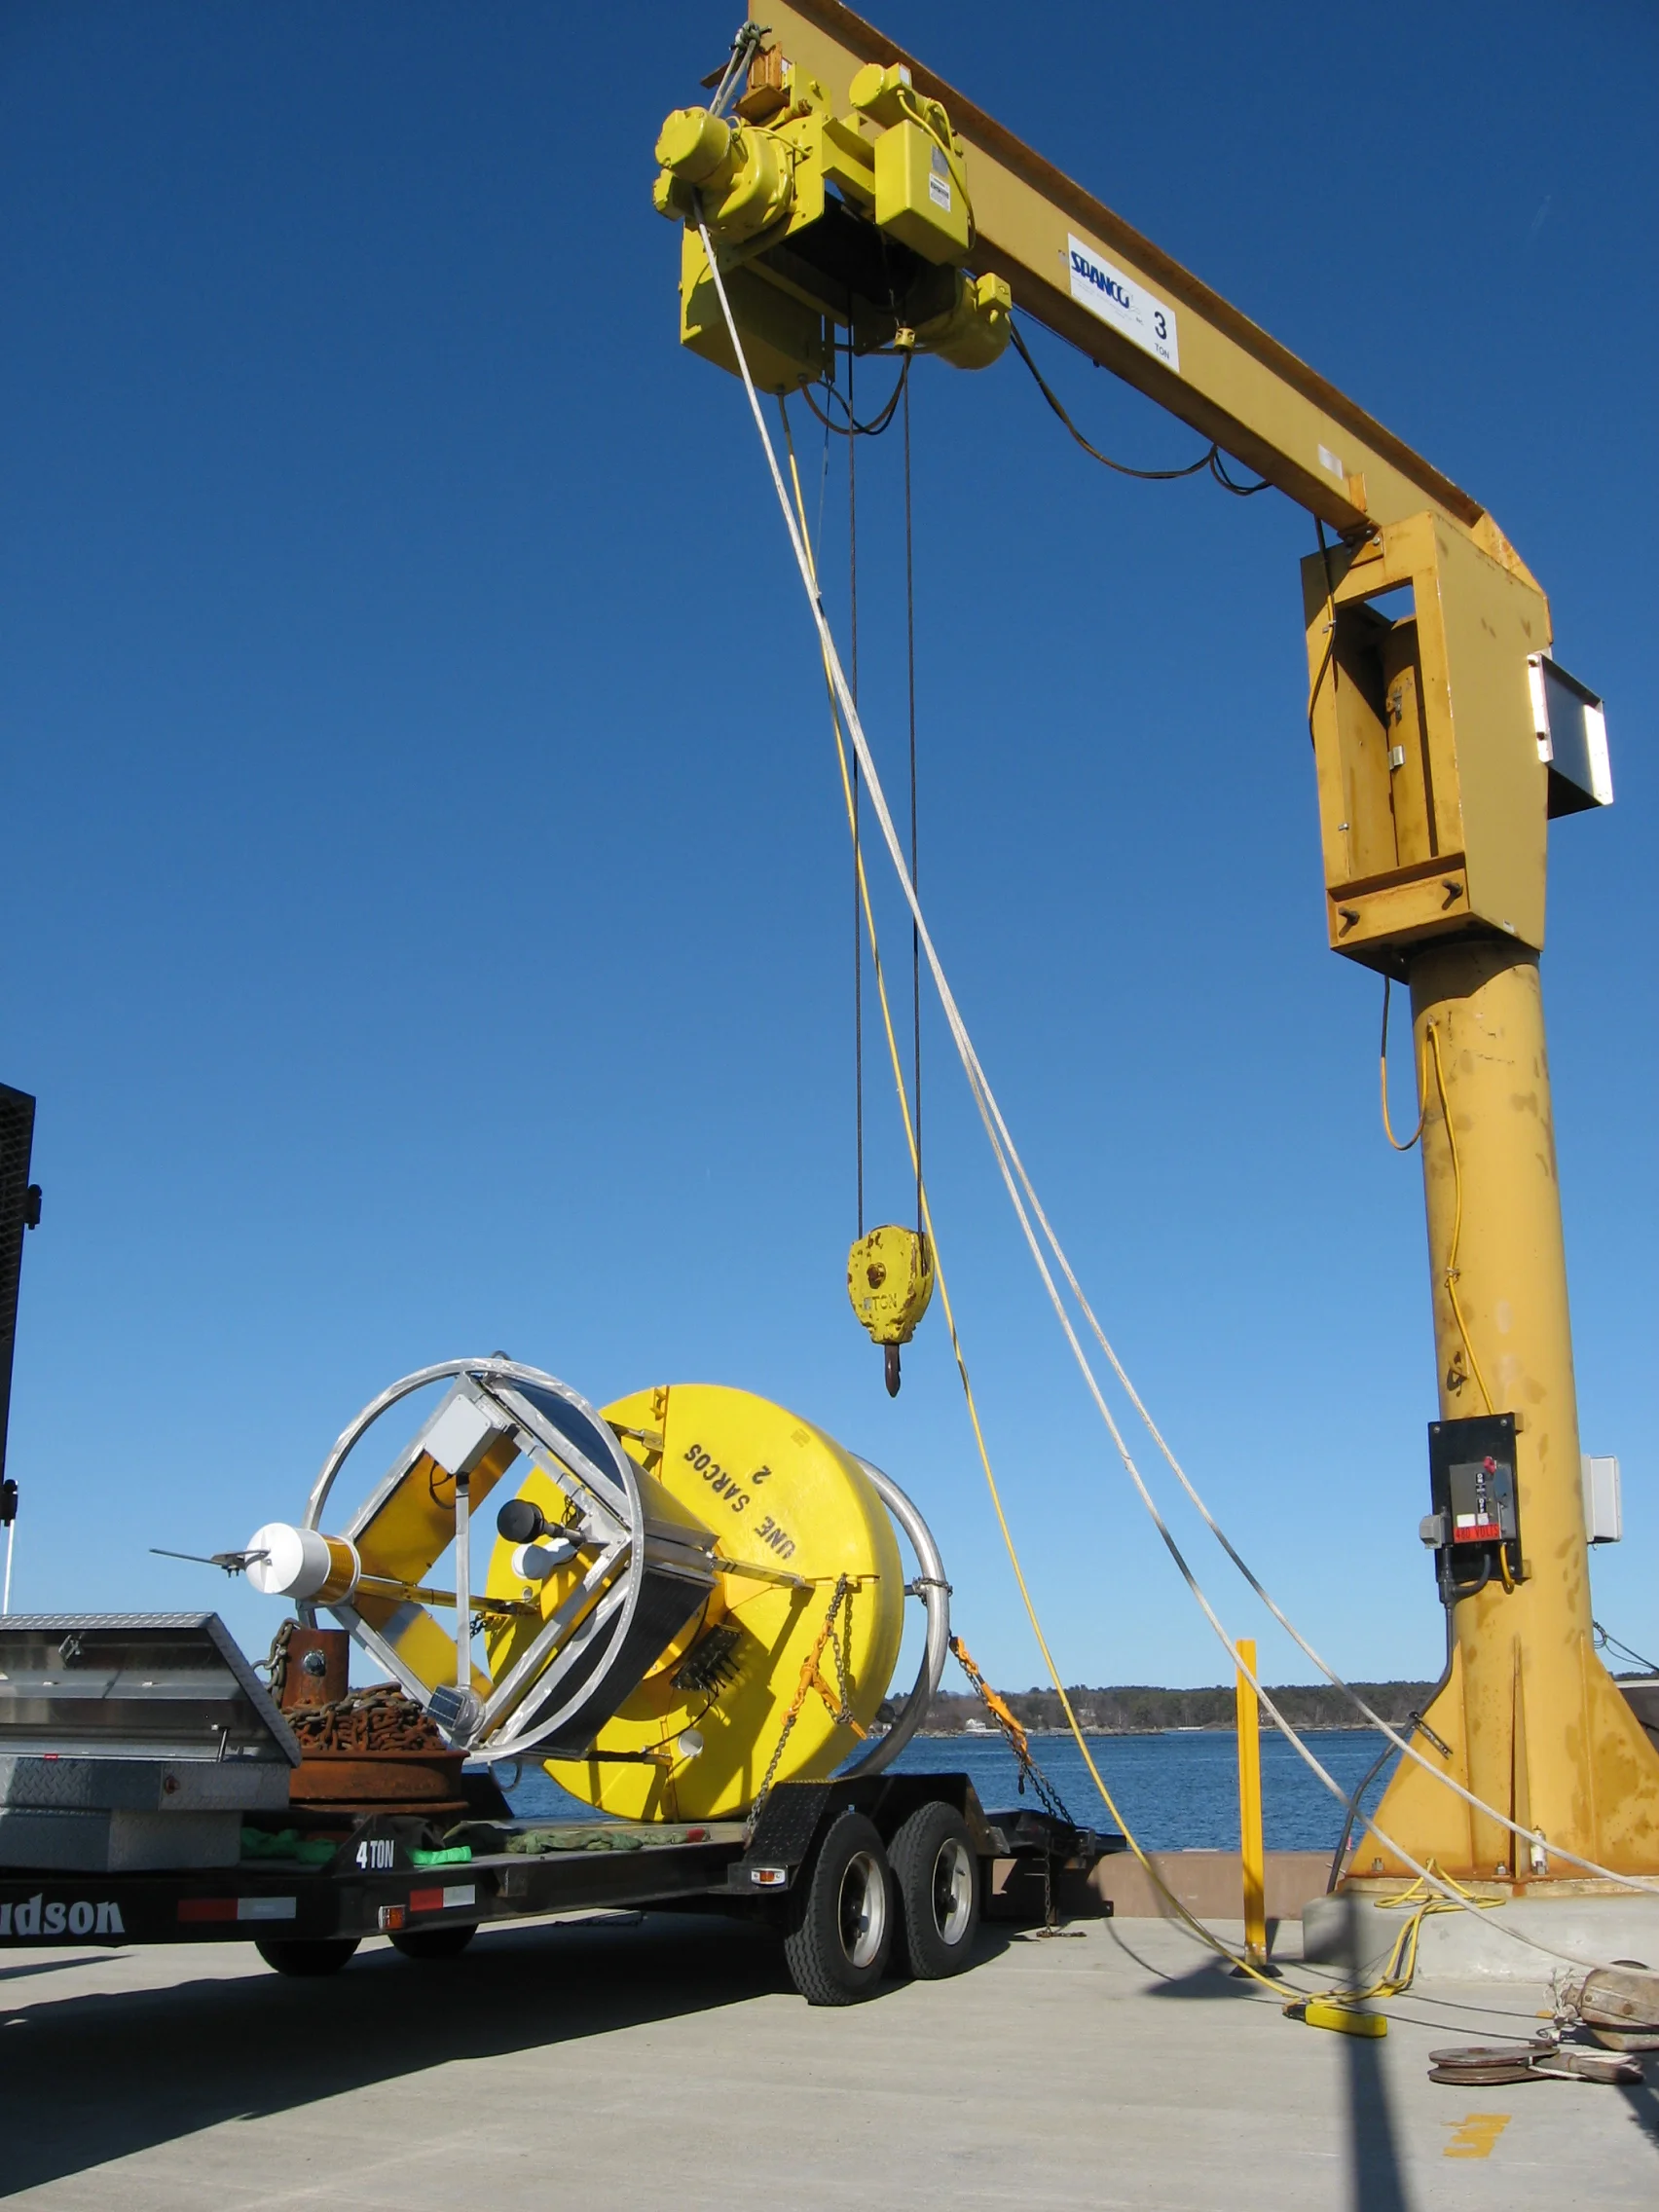
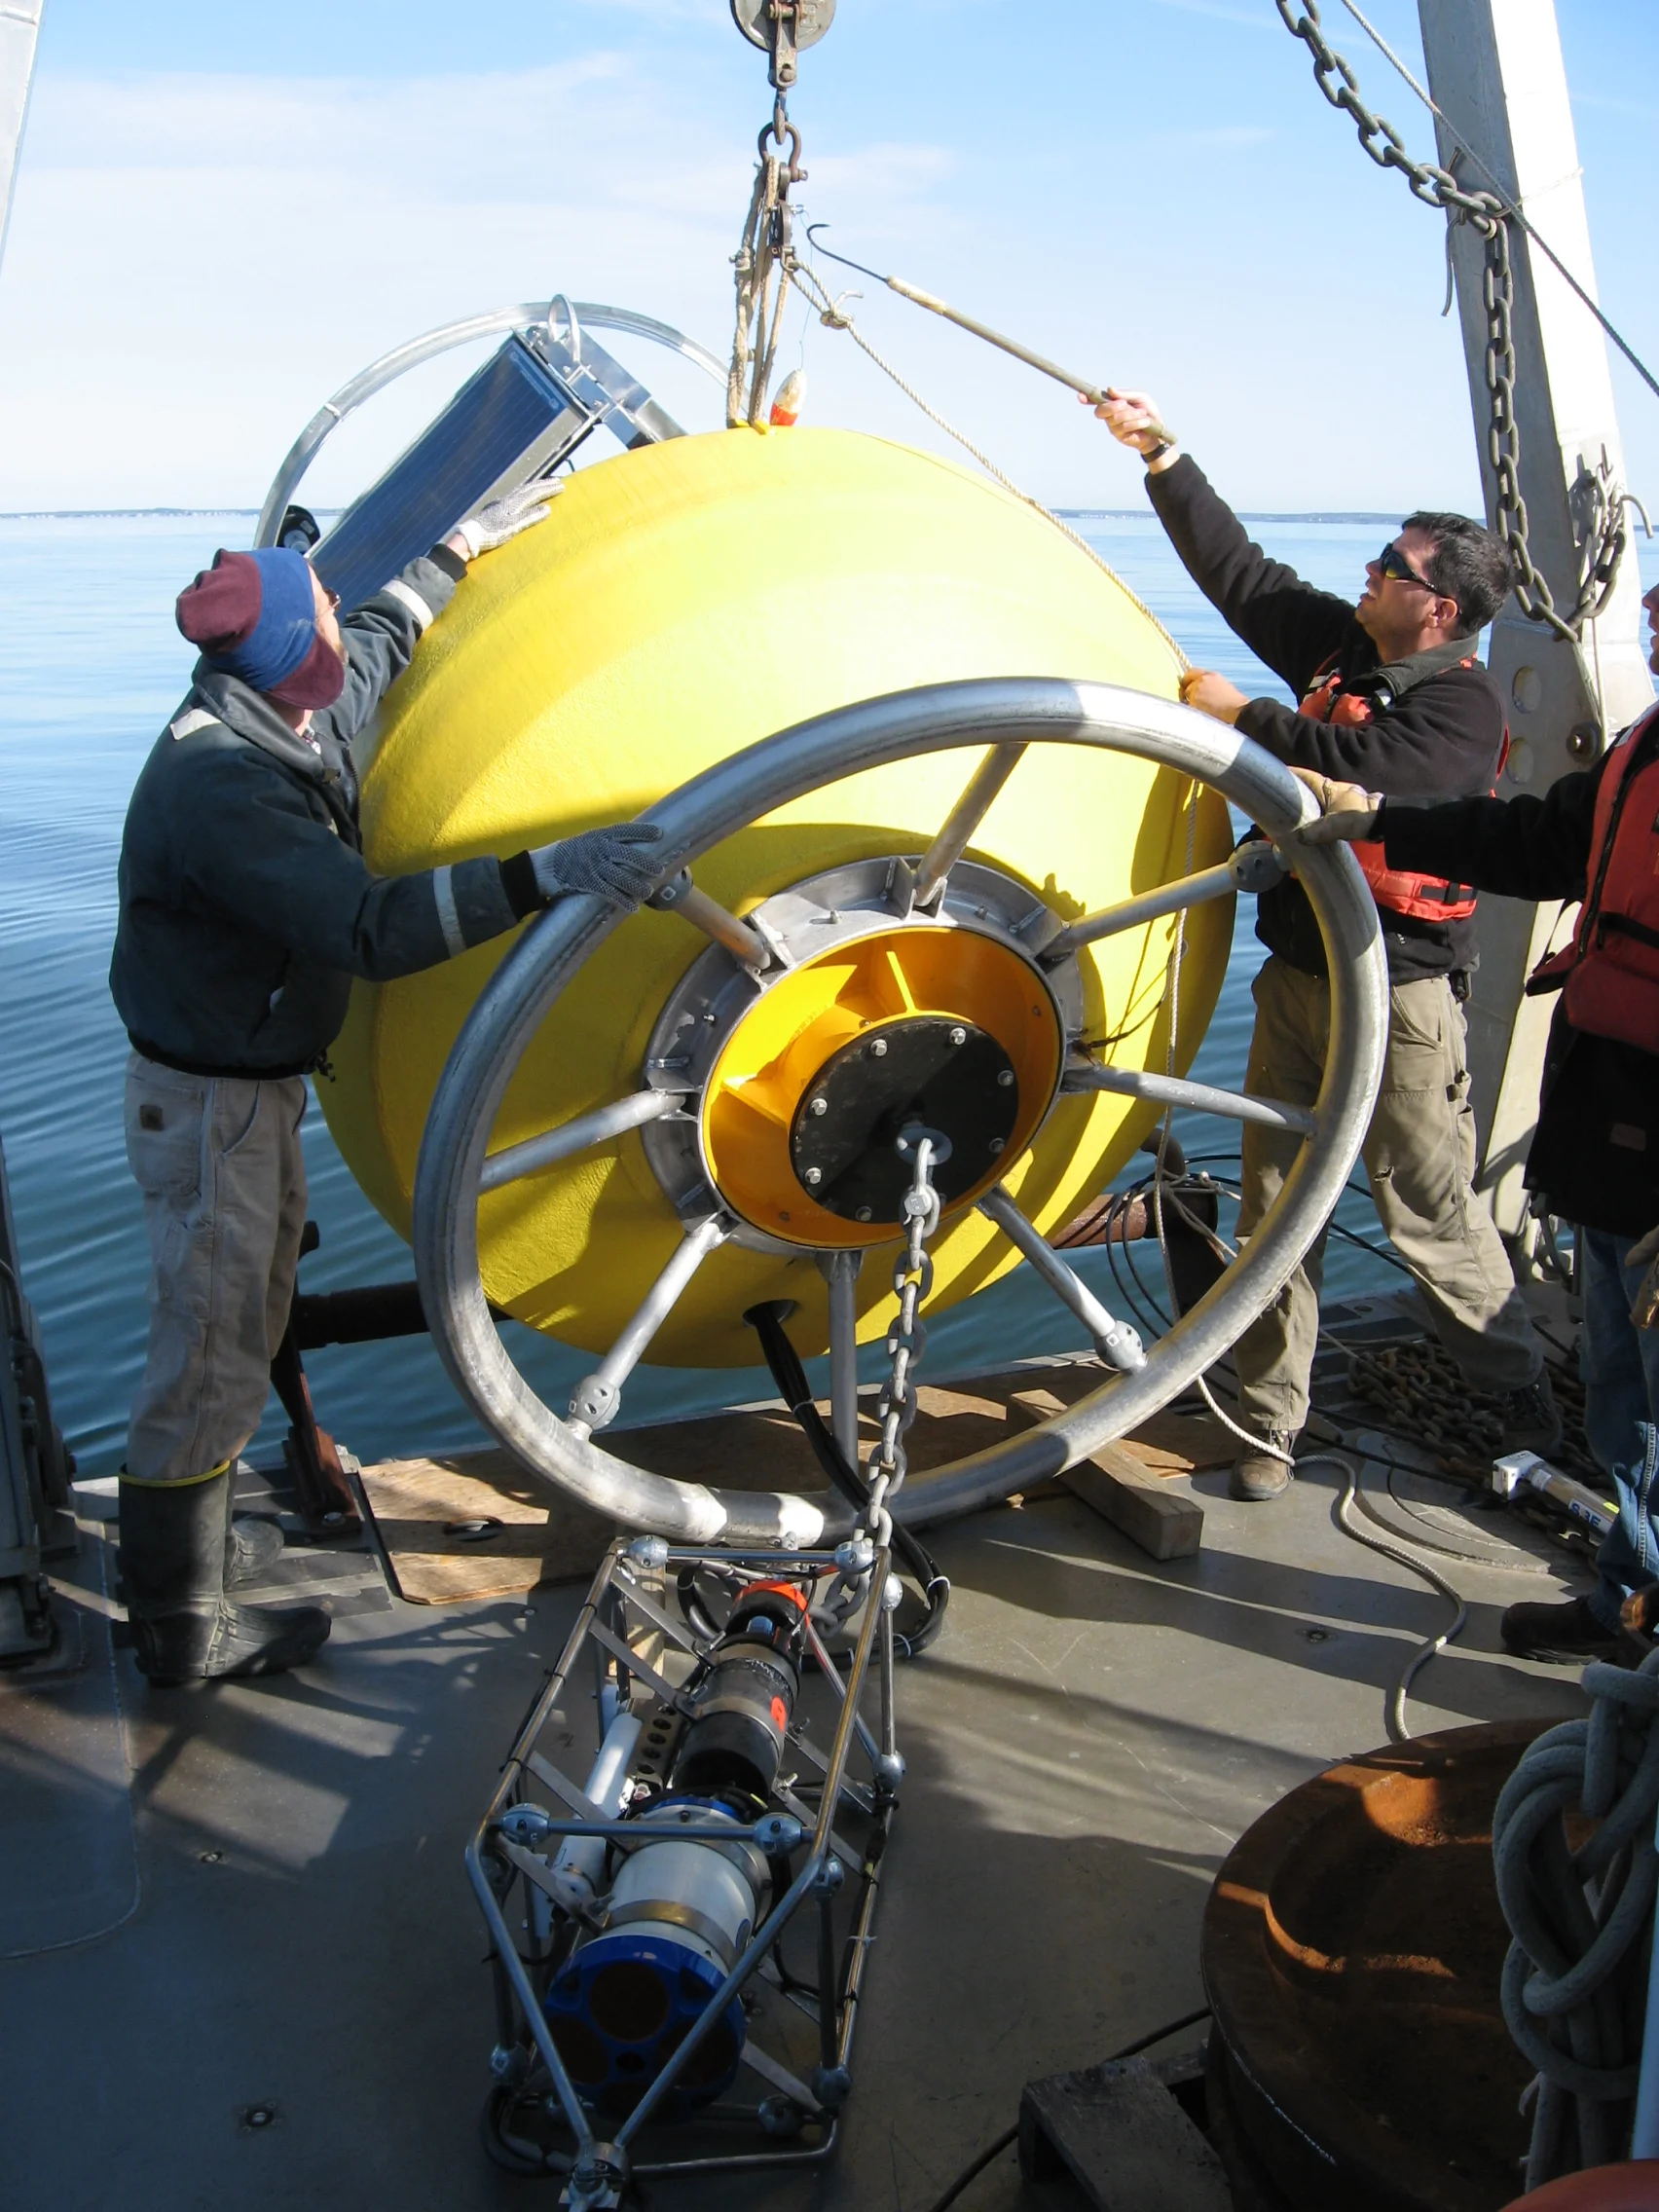
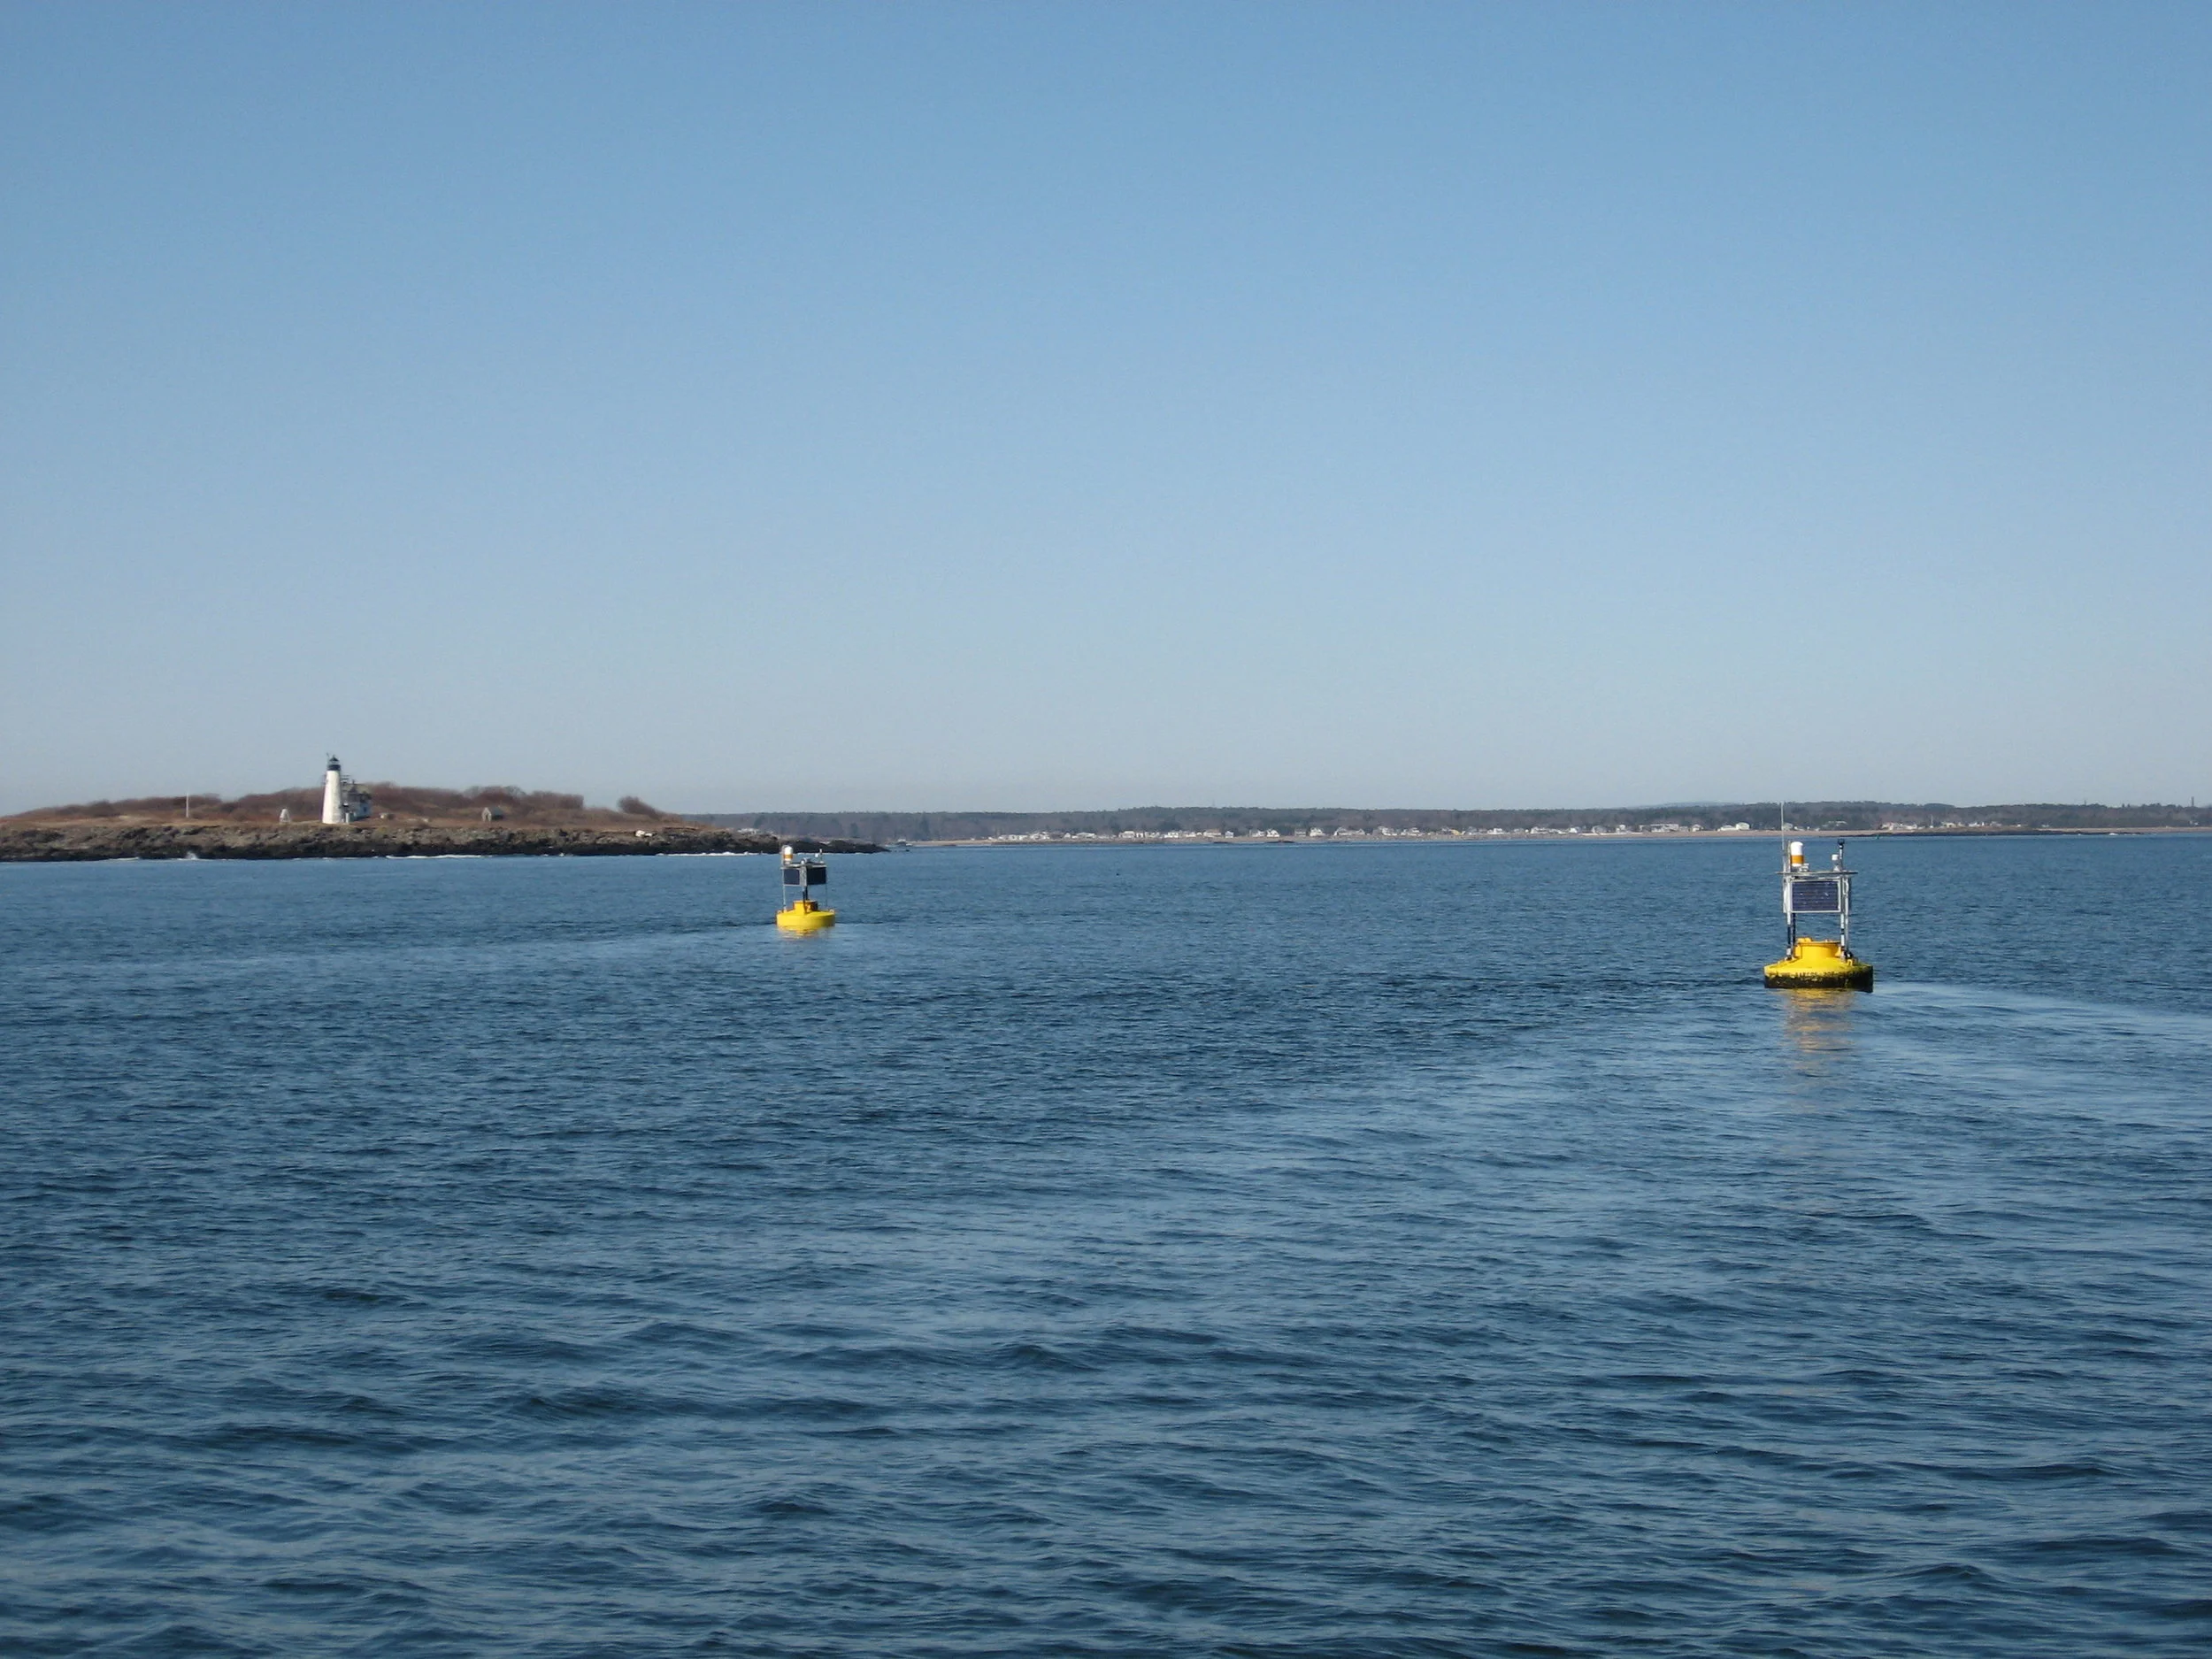
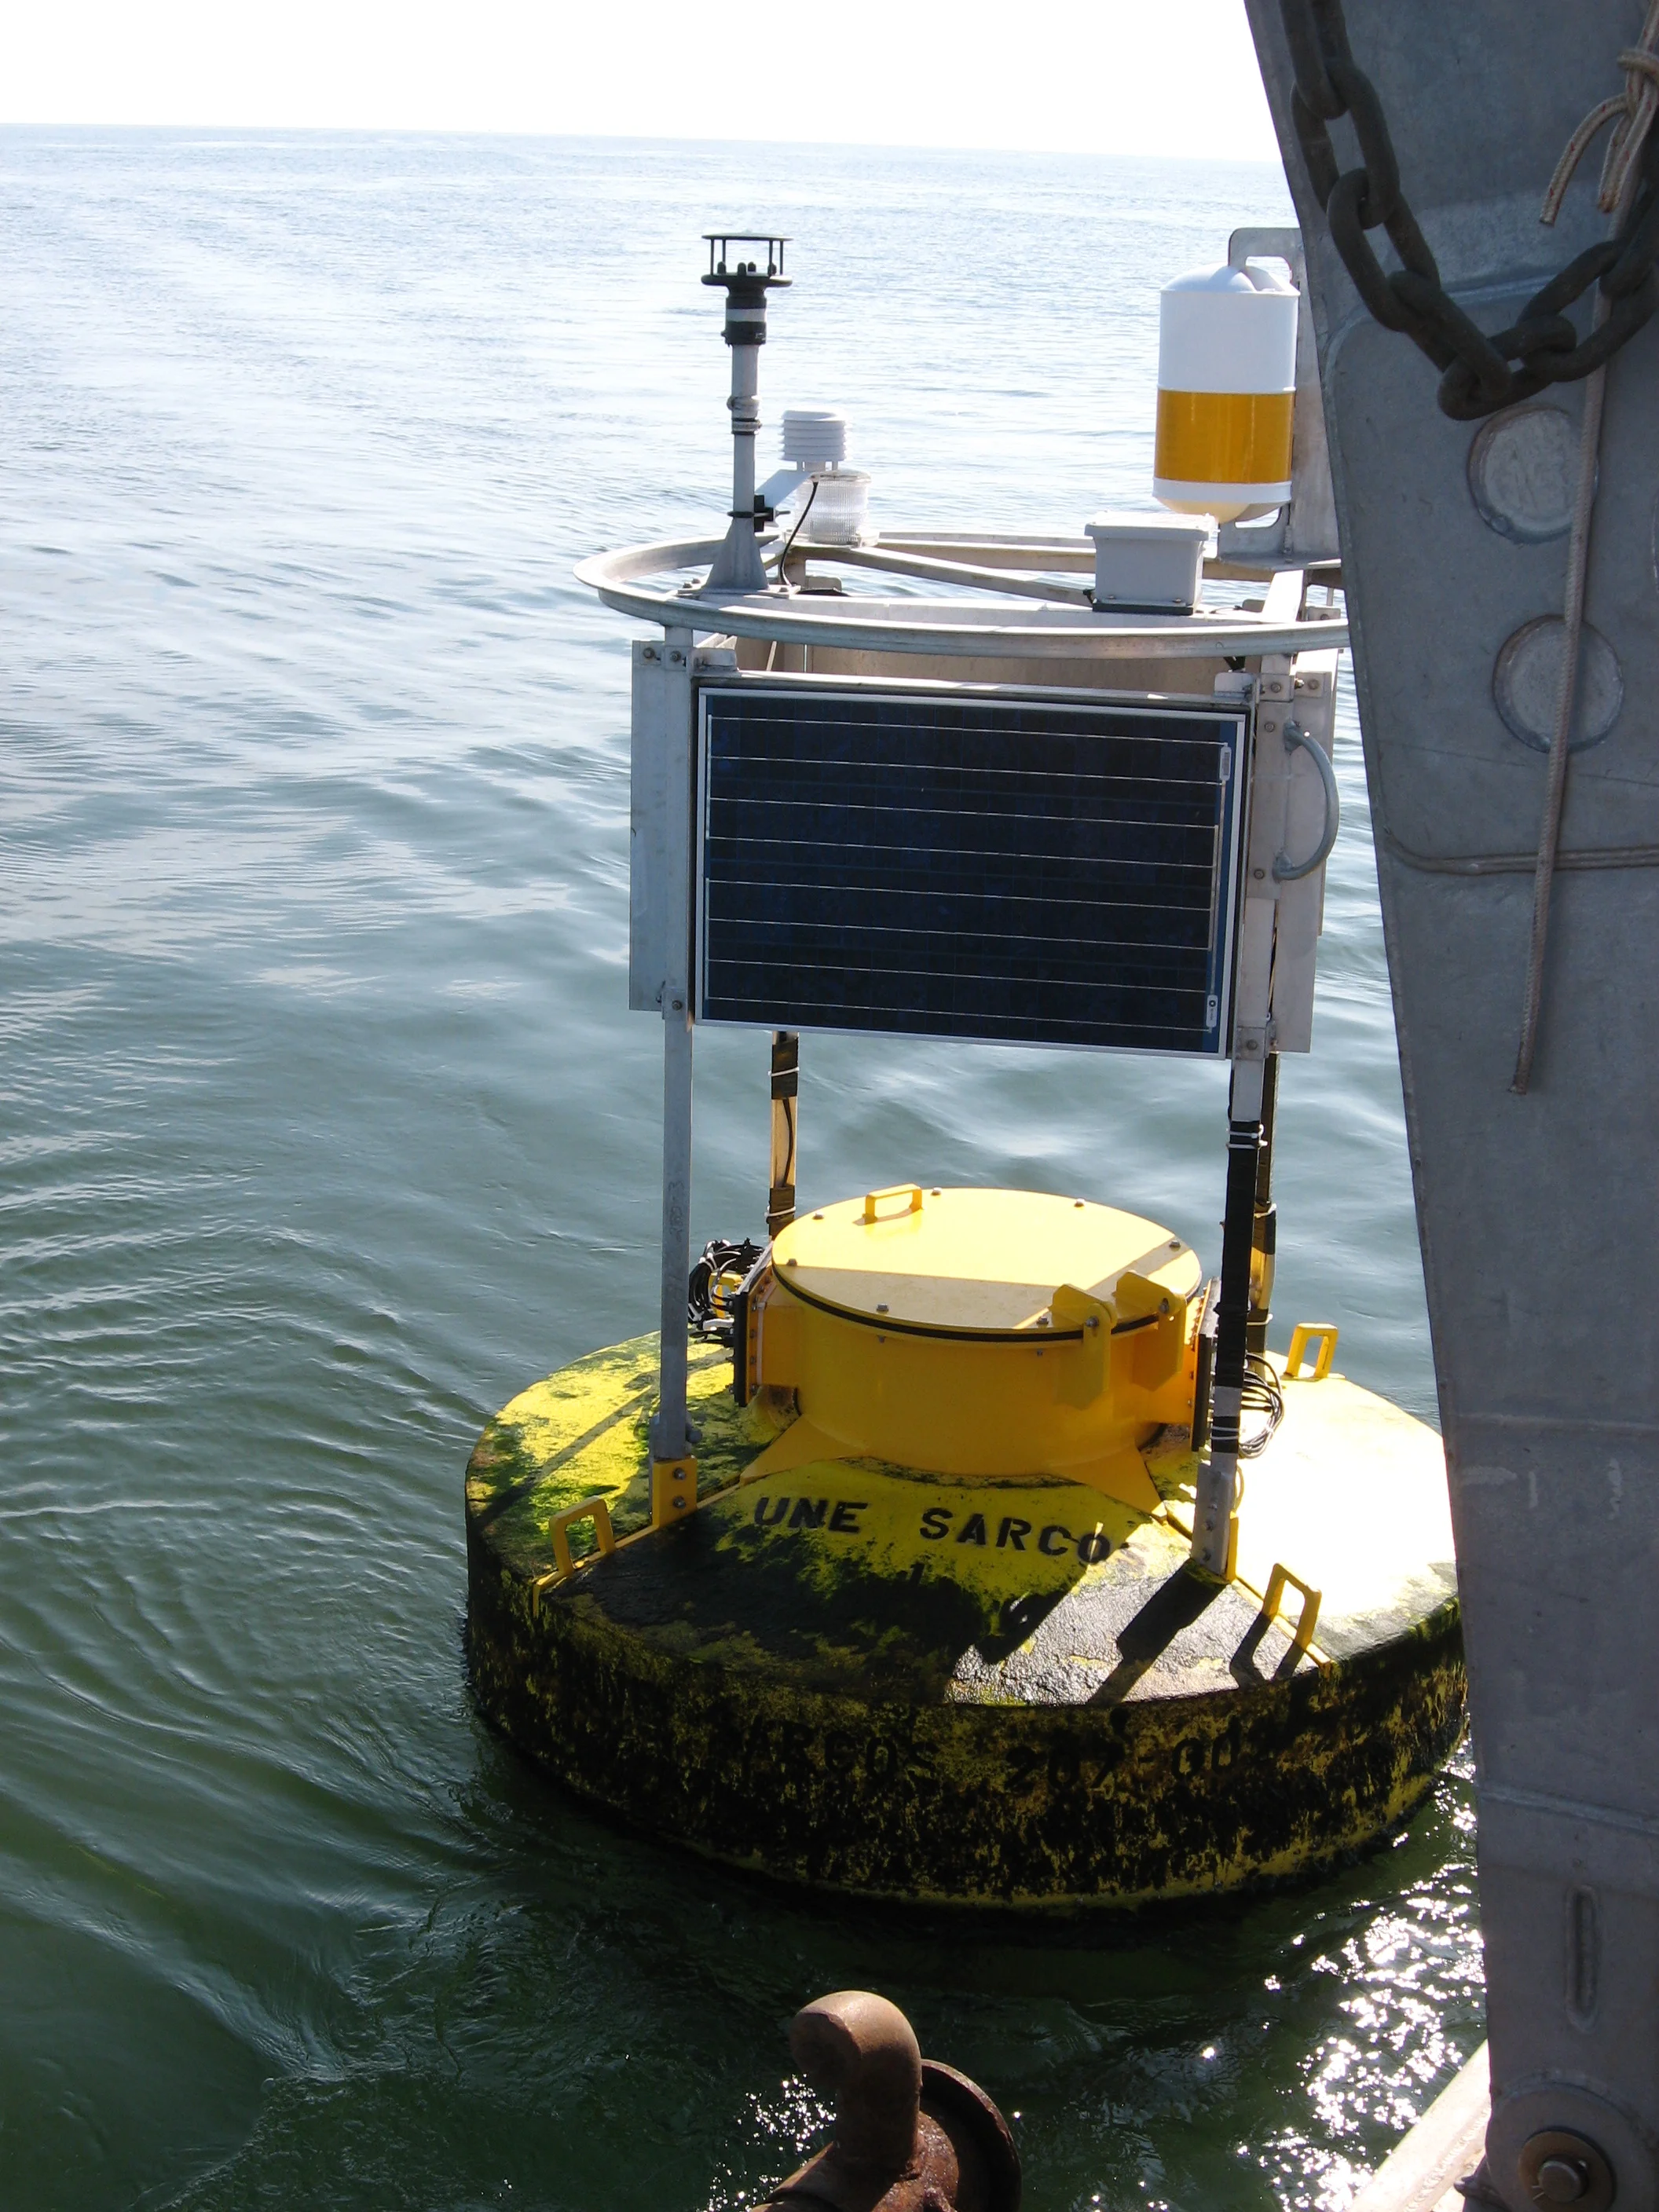
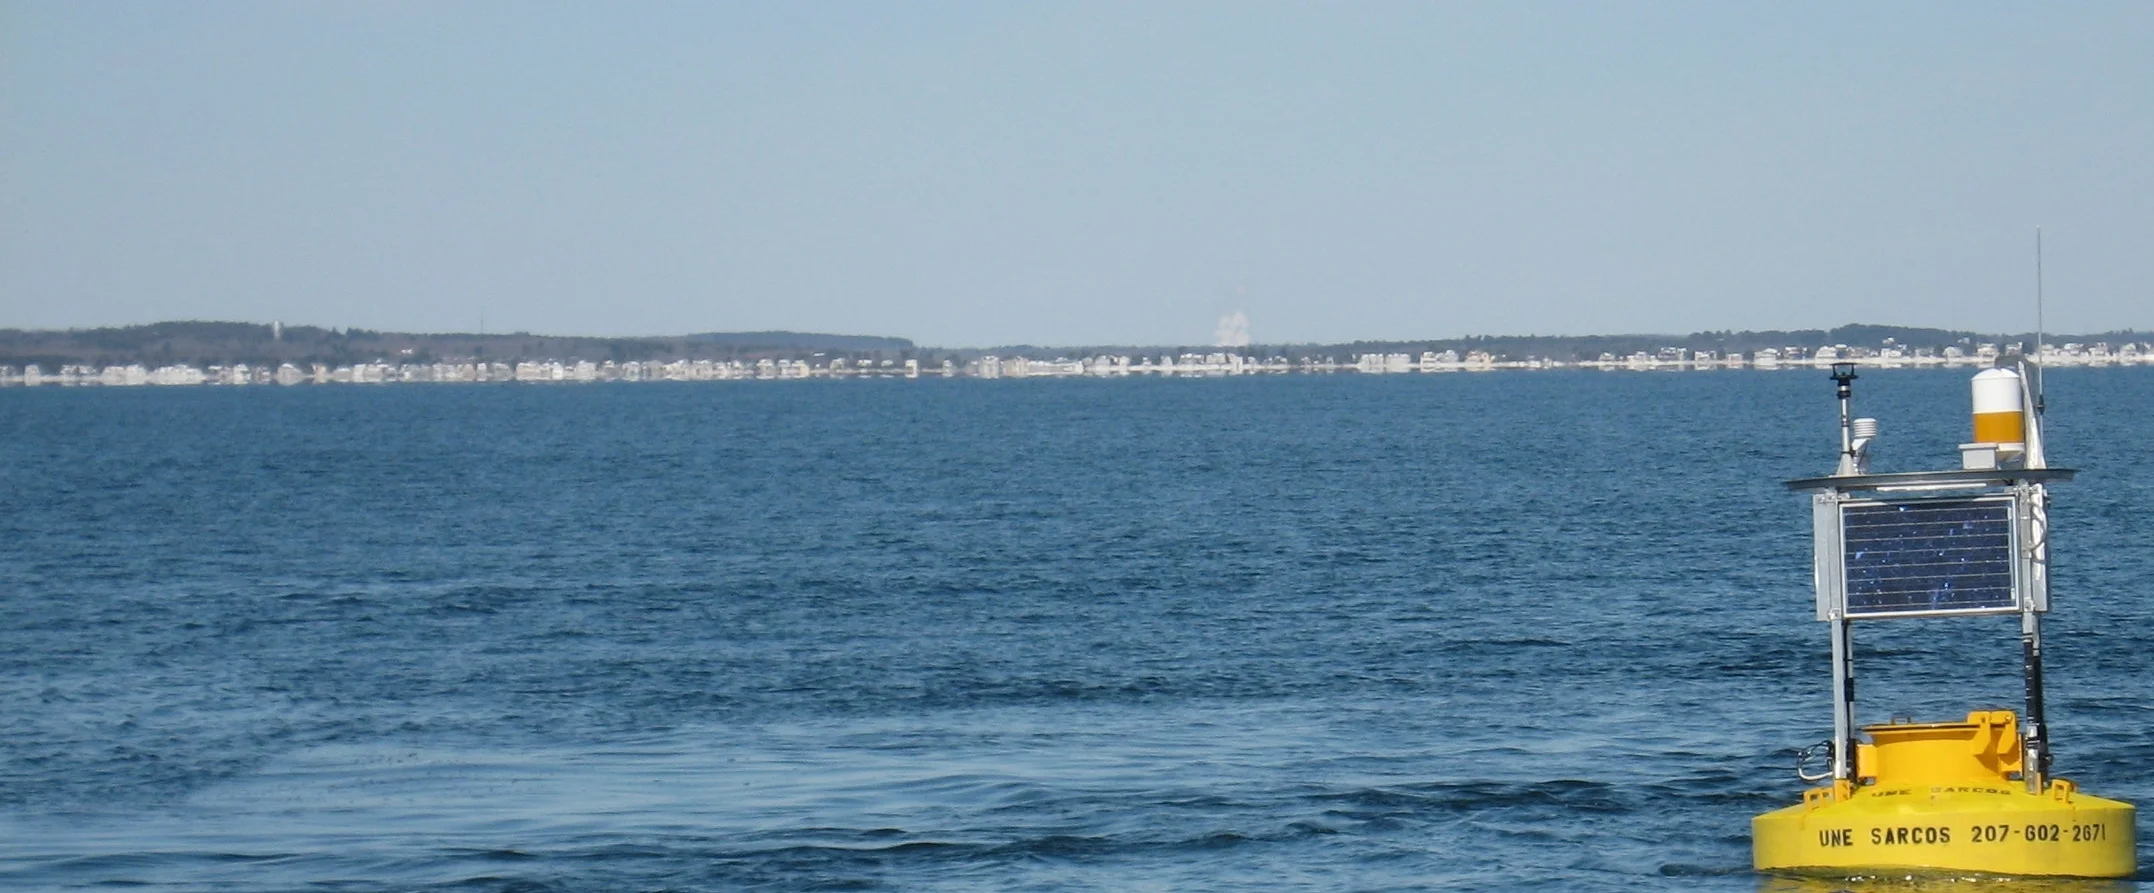
MEET THE BUOY: Data telemetry buoys house instrumentation that make air and water measurements. Data is sent back to shore via a cell signal and provides near real-time information for boaters, scientists, and commercial fishermen.
coastal observing system: (2007-2012)
The Saco River Coastal Observing System (SaRCOS) was developed to examine the interrelationships of physics, chemistry, biology, mathematics, and geology in the local Saco River watershed. Its purpose was to investigate how precipitation drives river discharge, which in turn, affects Western Maine Coastal Current.
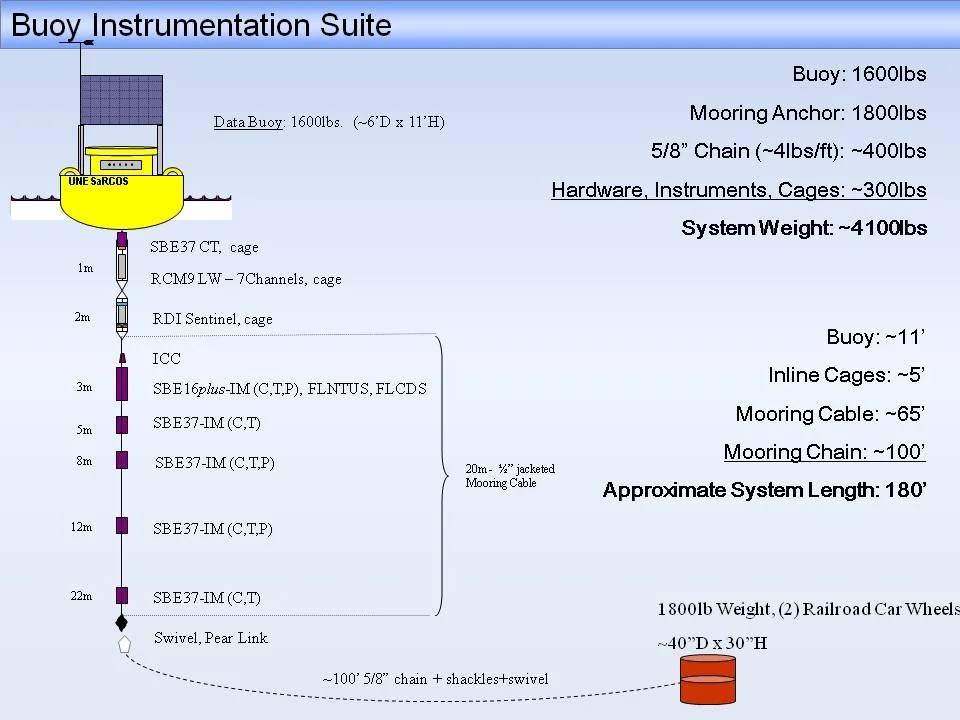
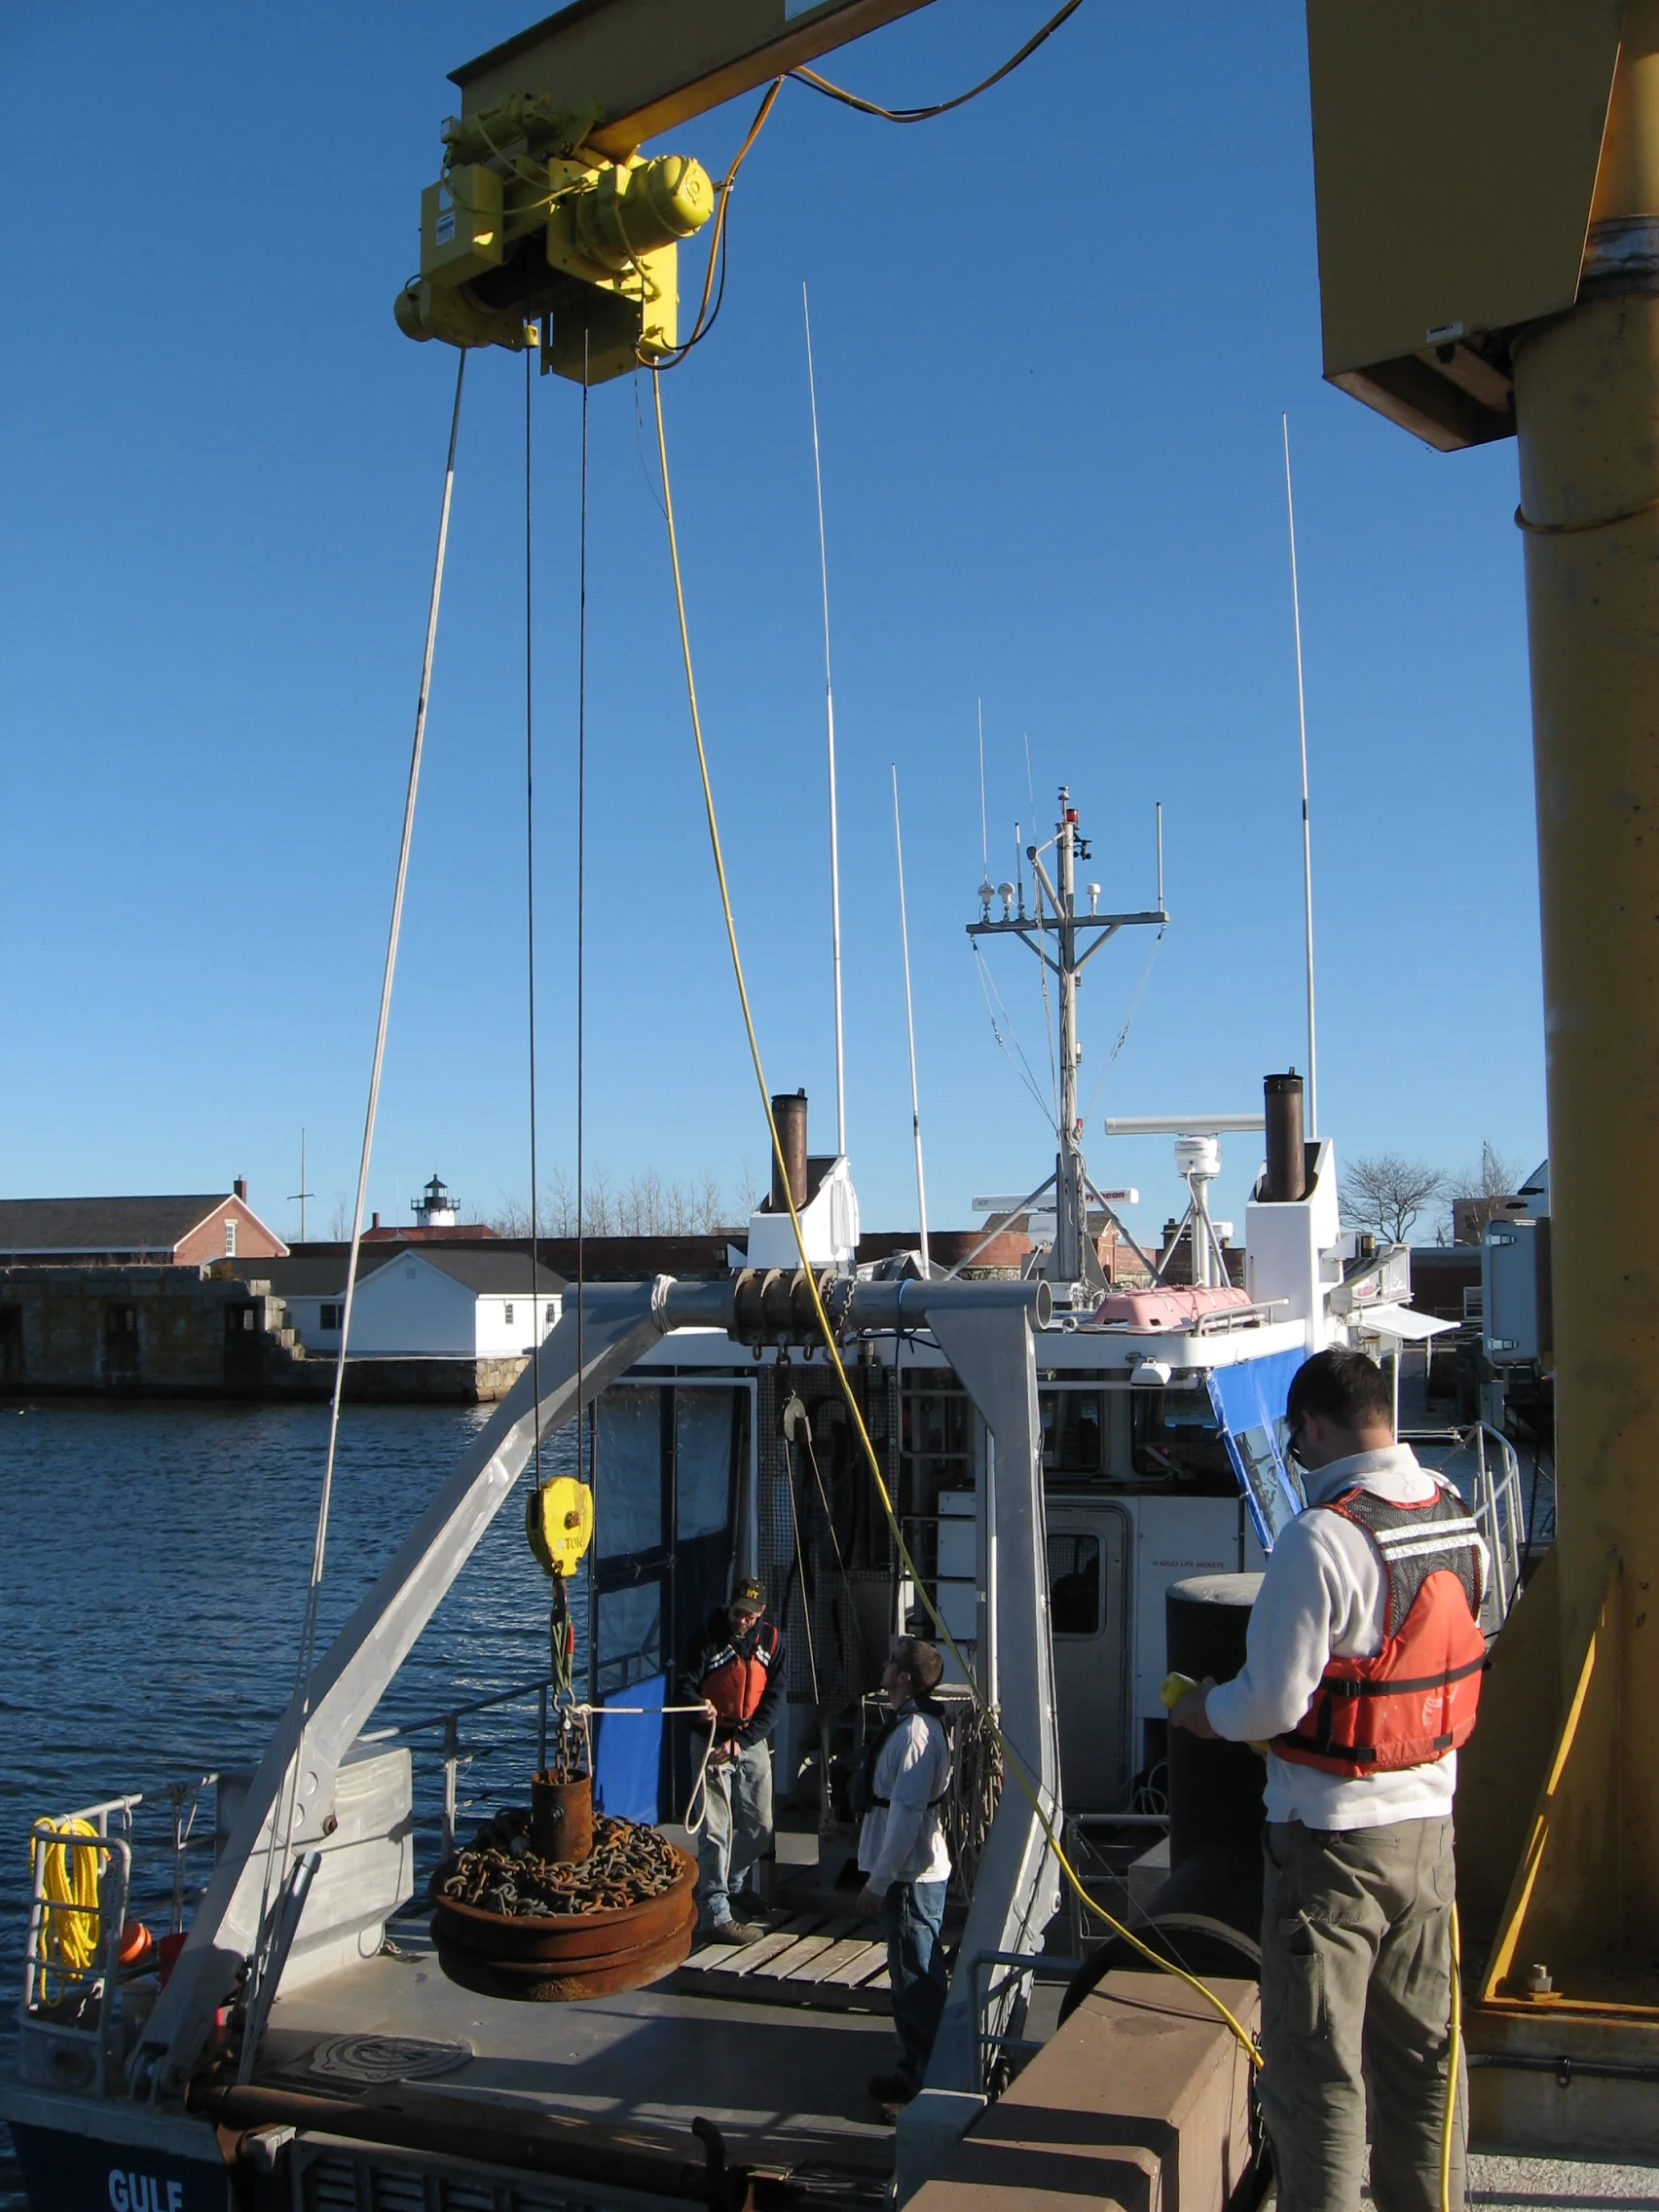
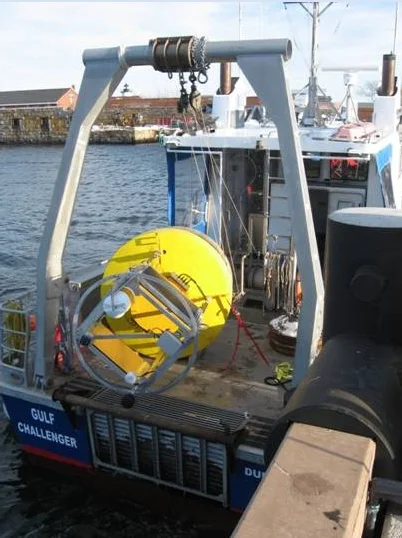
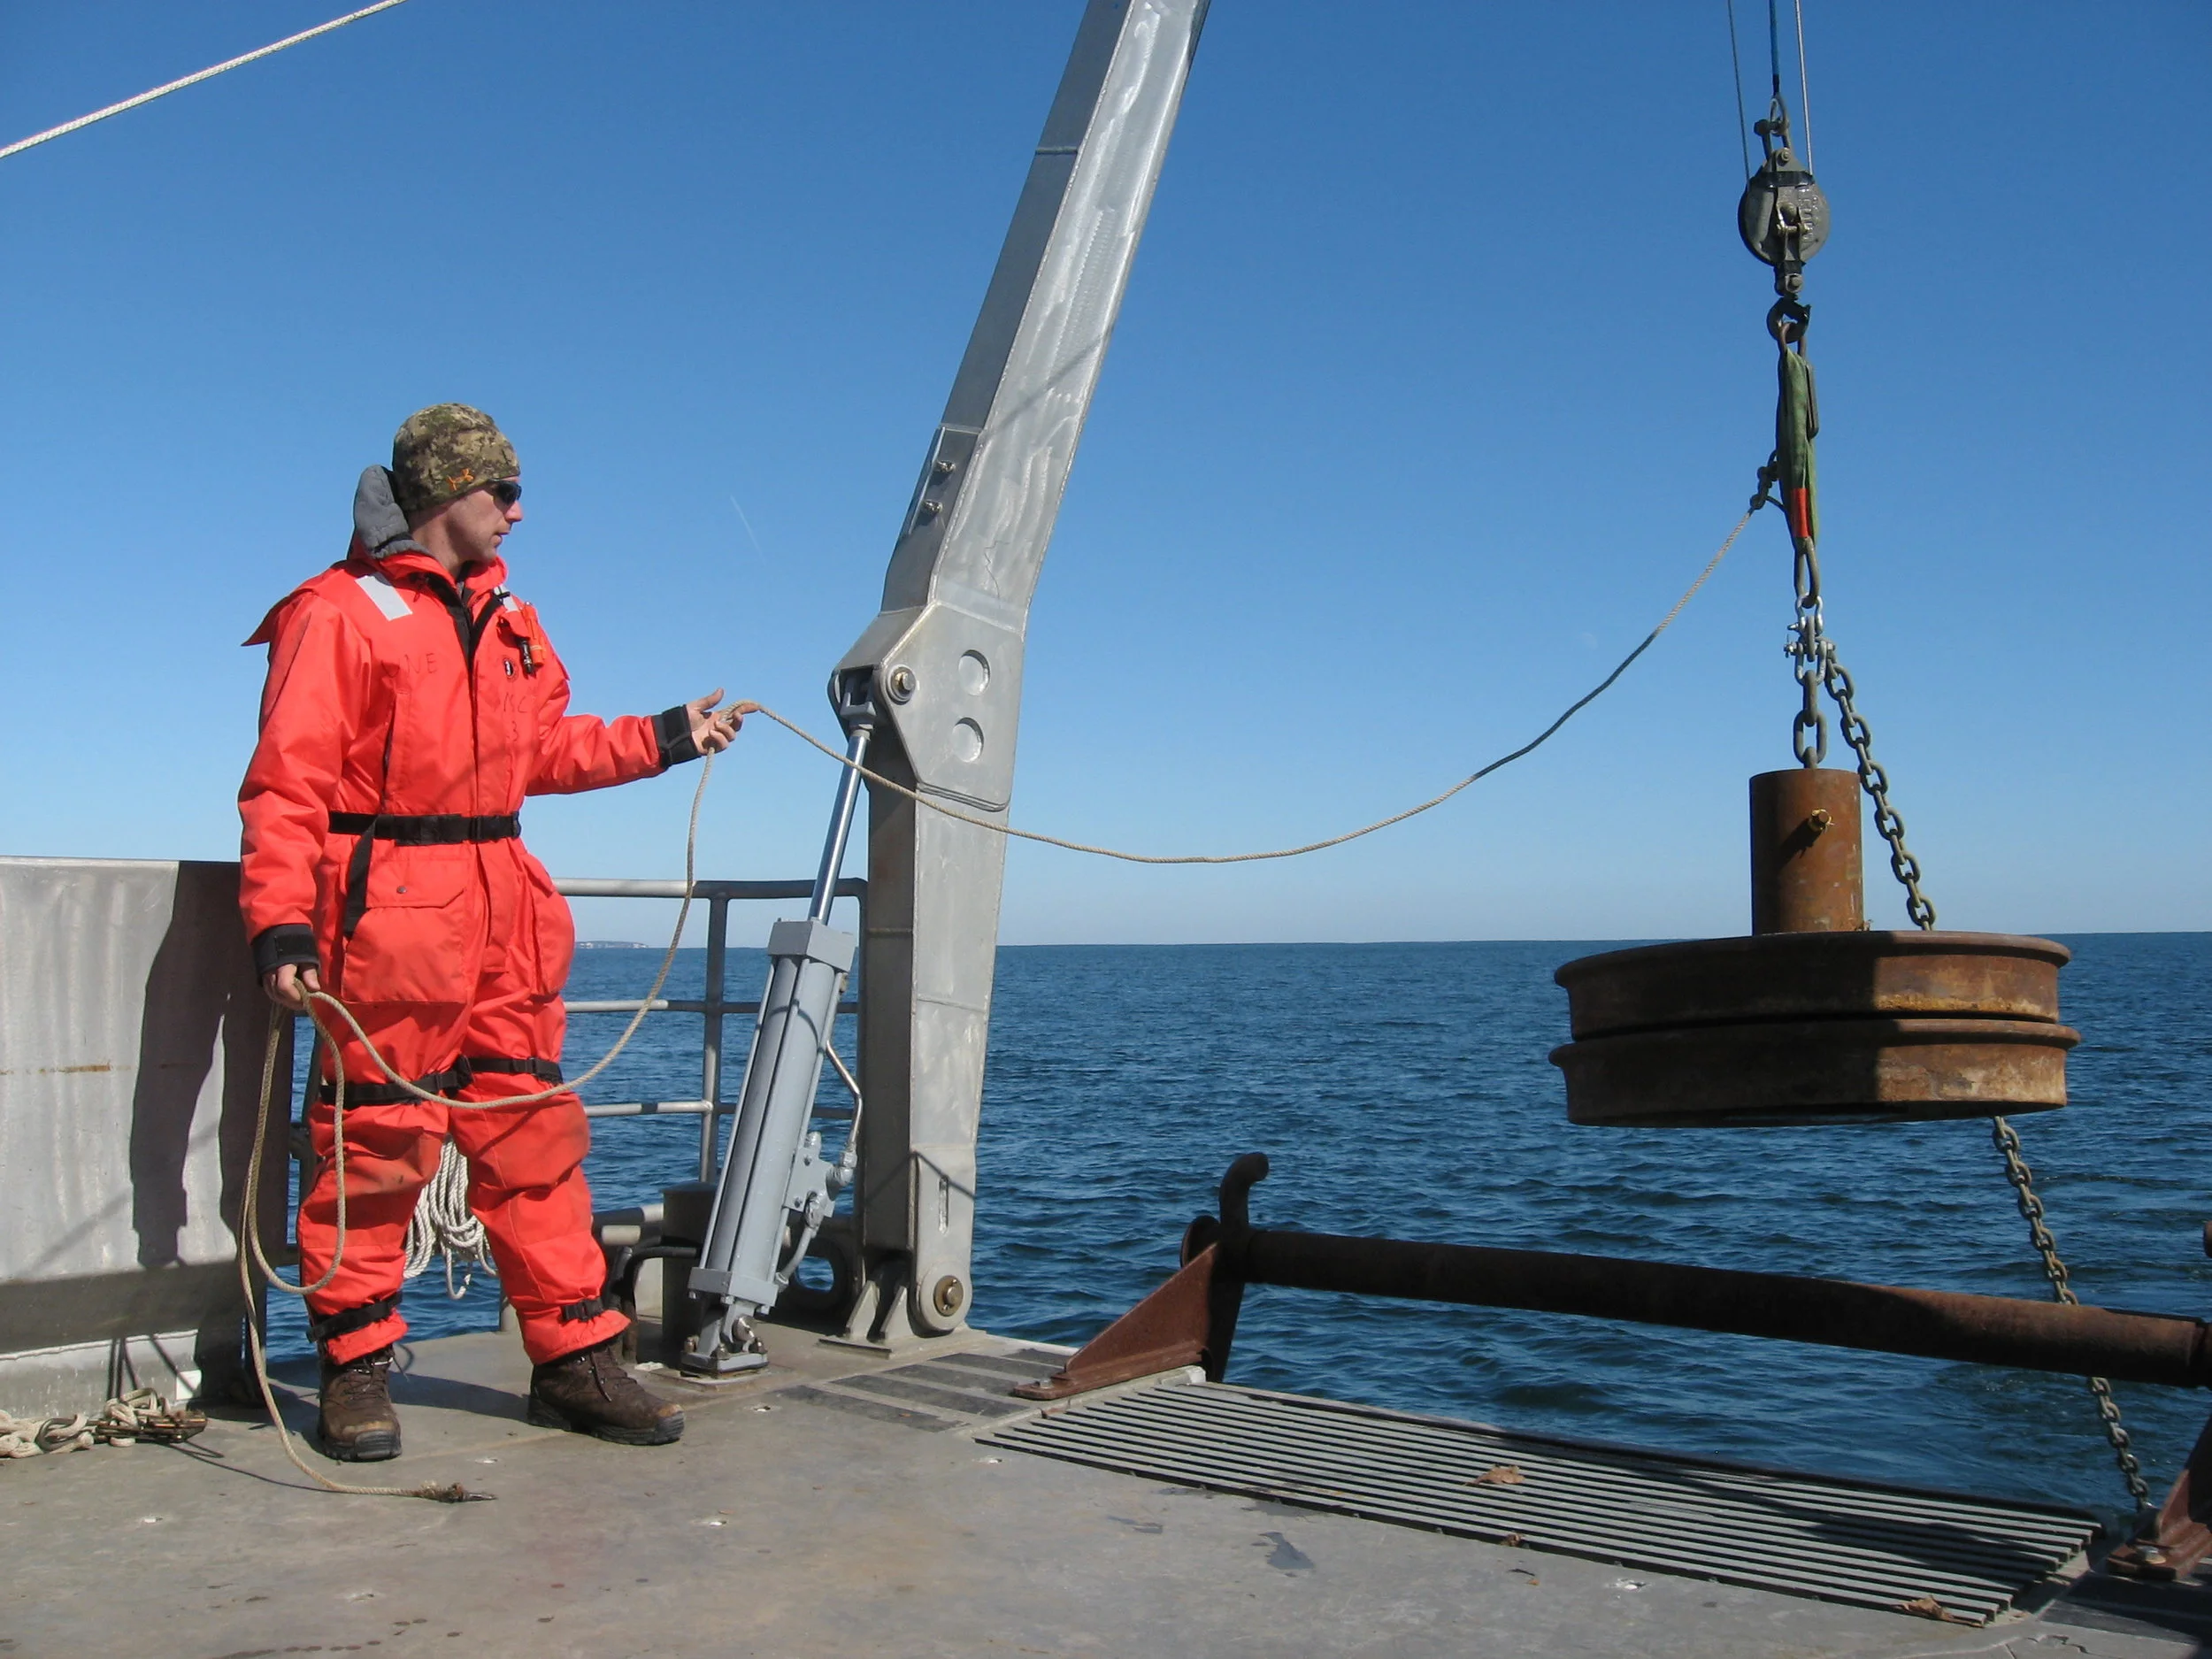
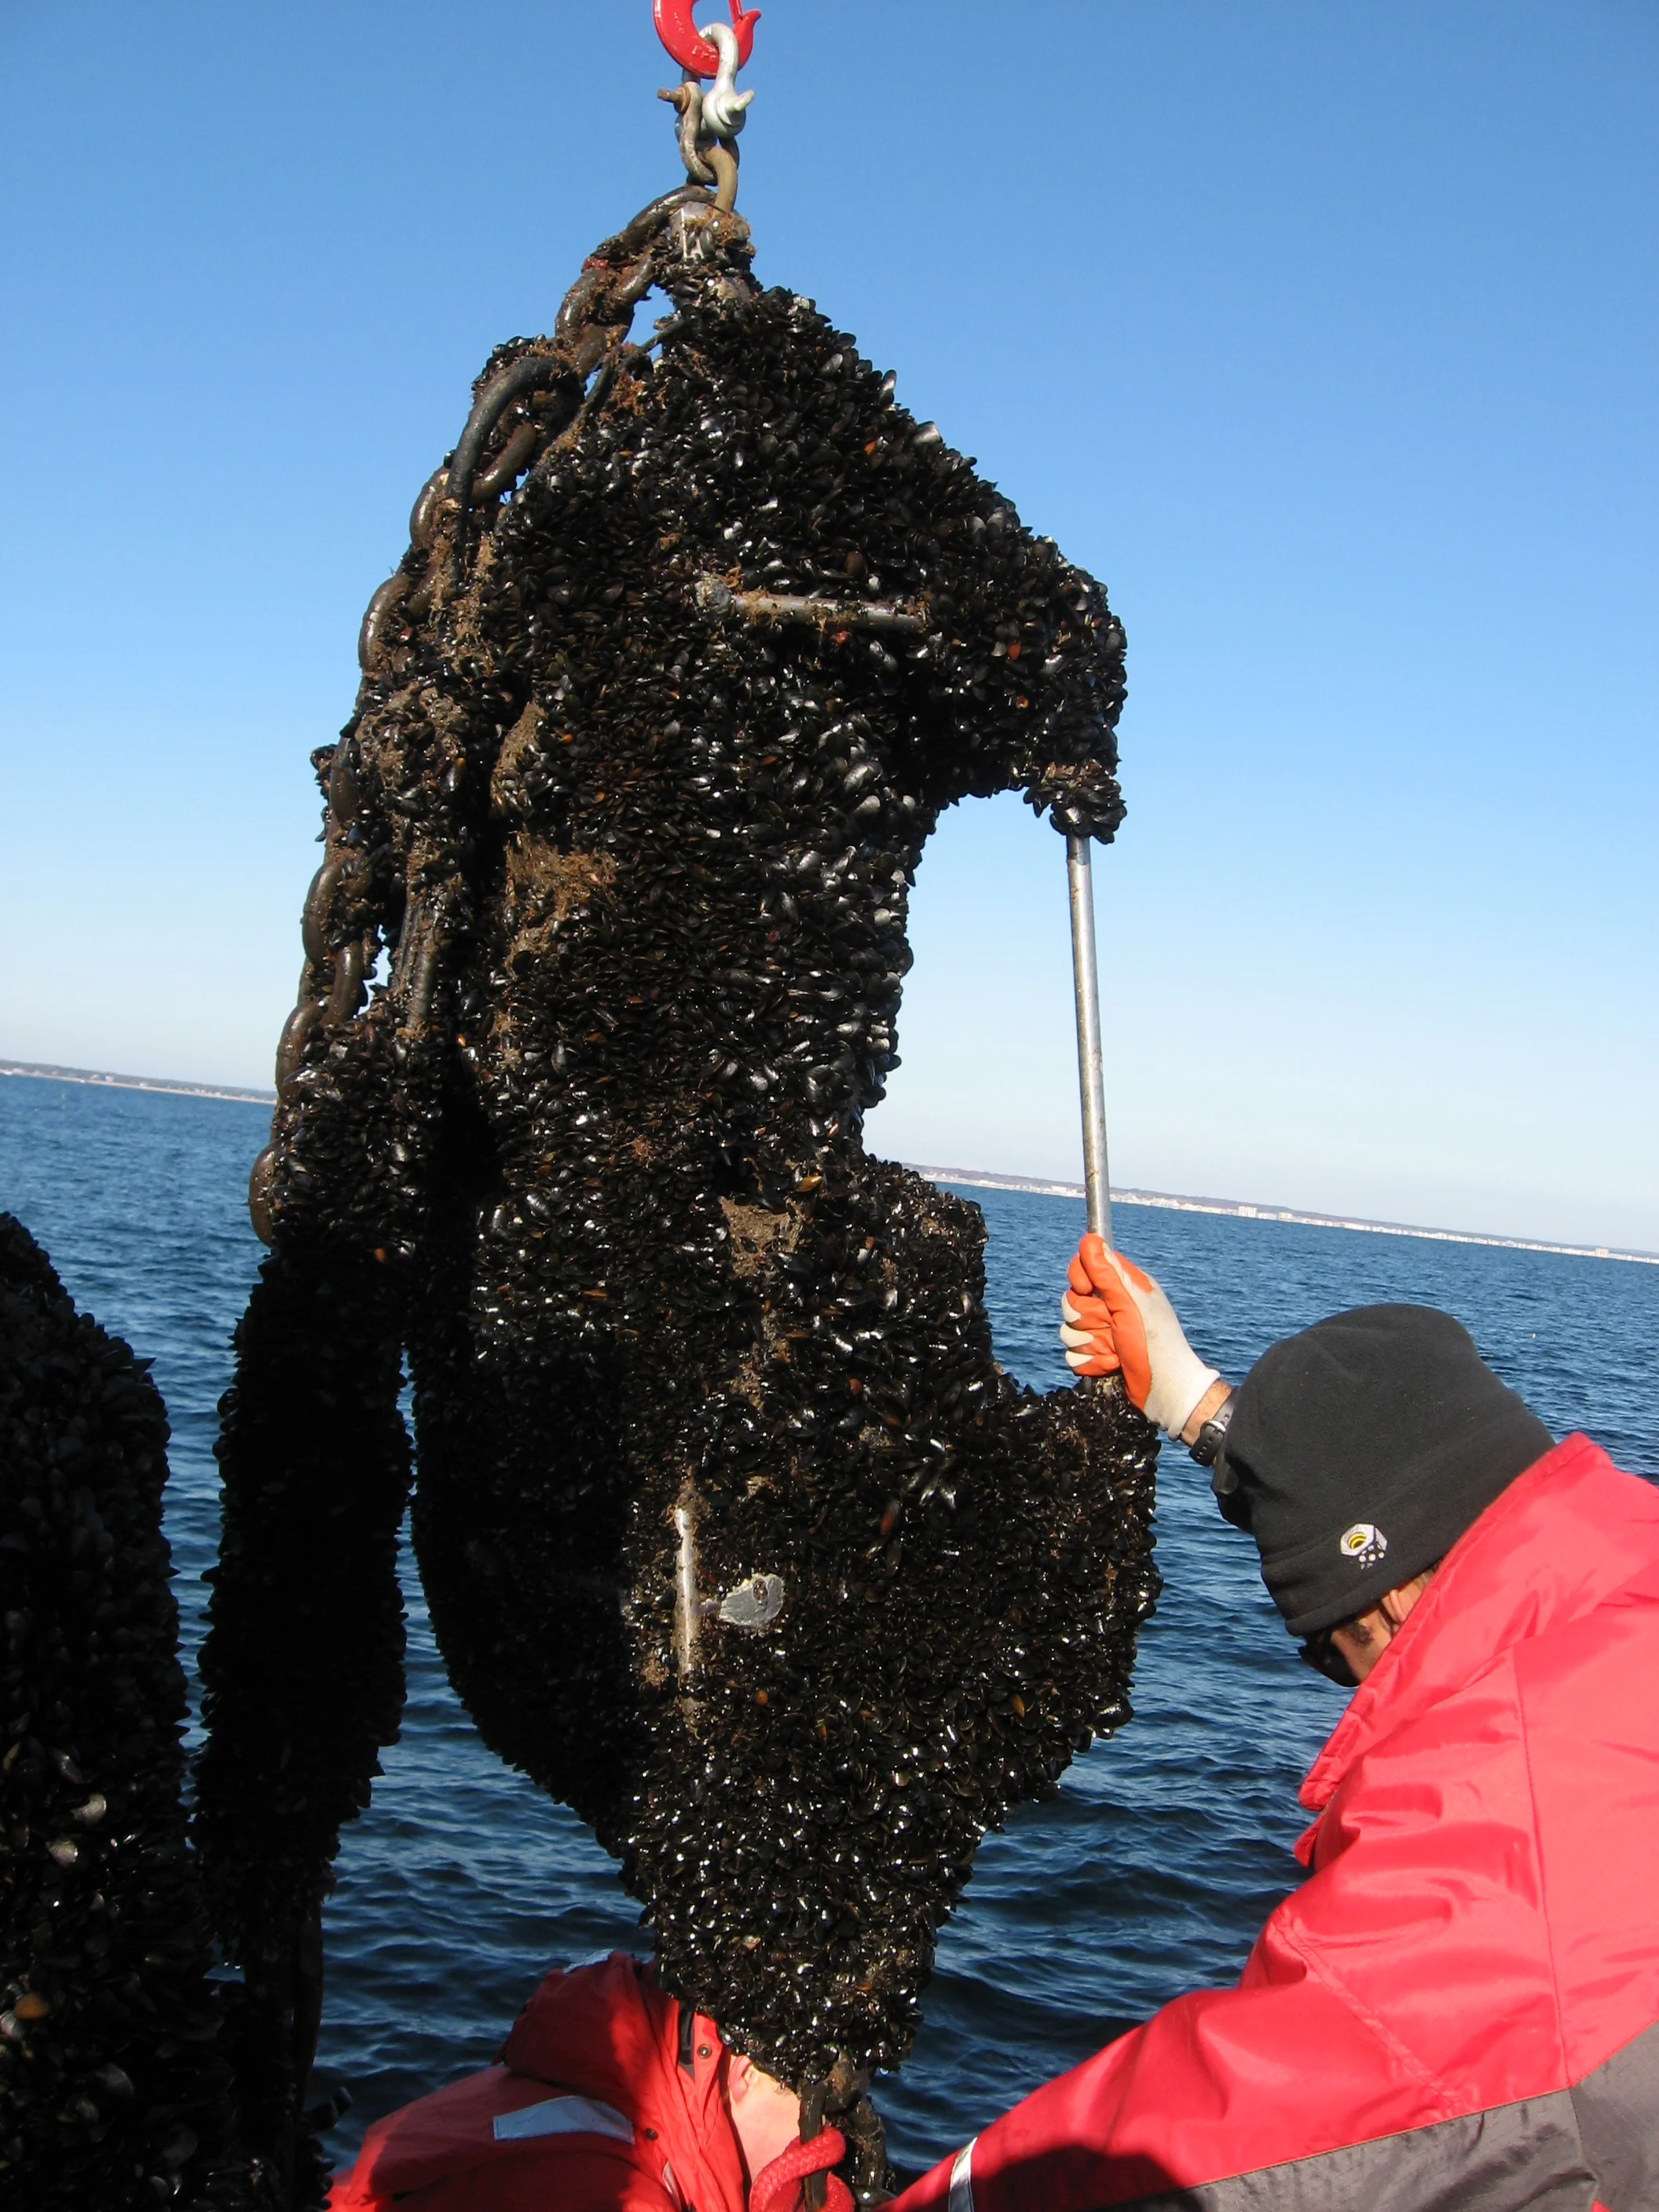
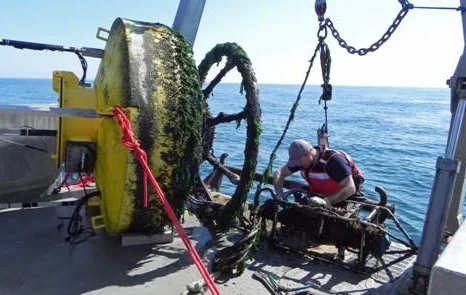
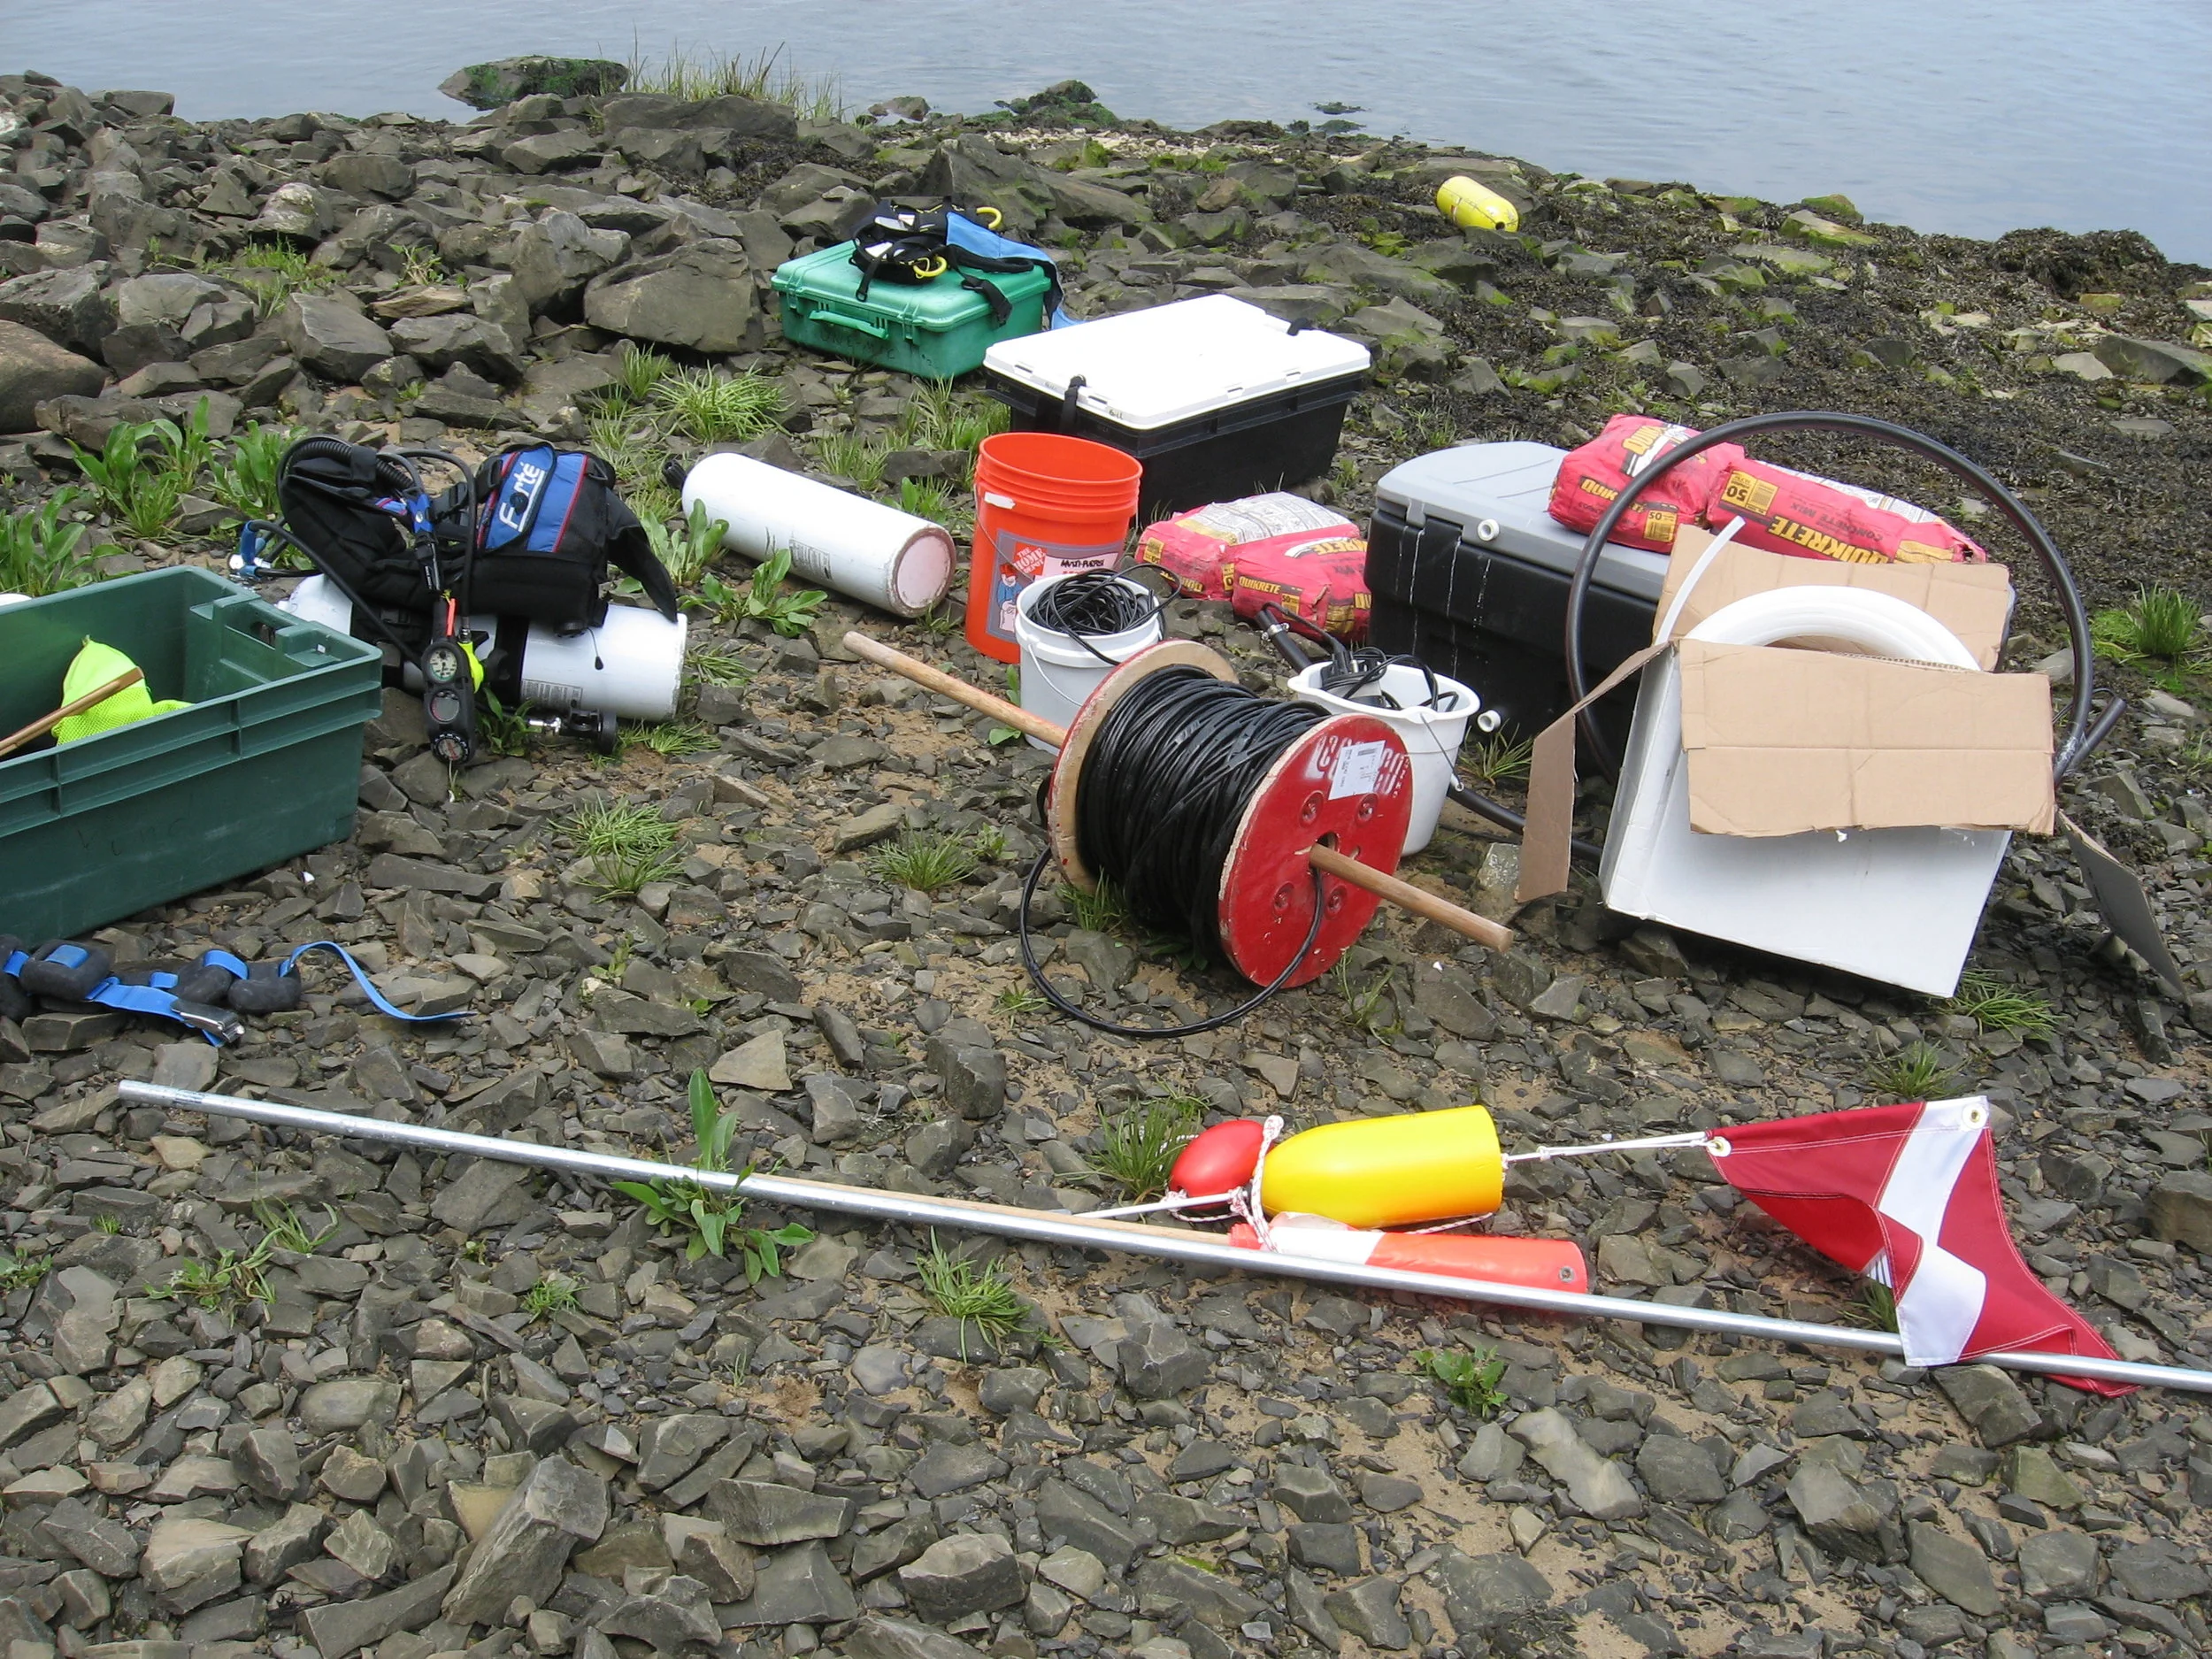
The costal observing system was a suite of instruments, the bulk of which were deployed as part of a buoy telemetry system strategically located along a transect through the Saco River plume, approximately 2km from the point of discharge.
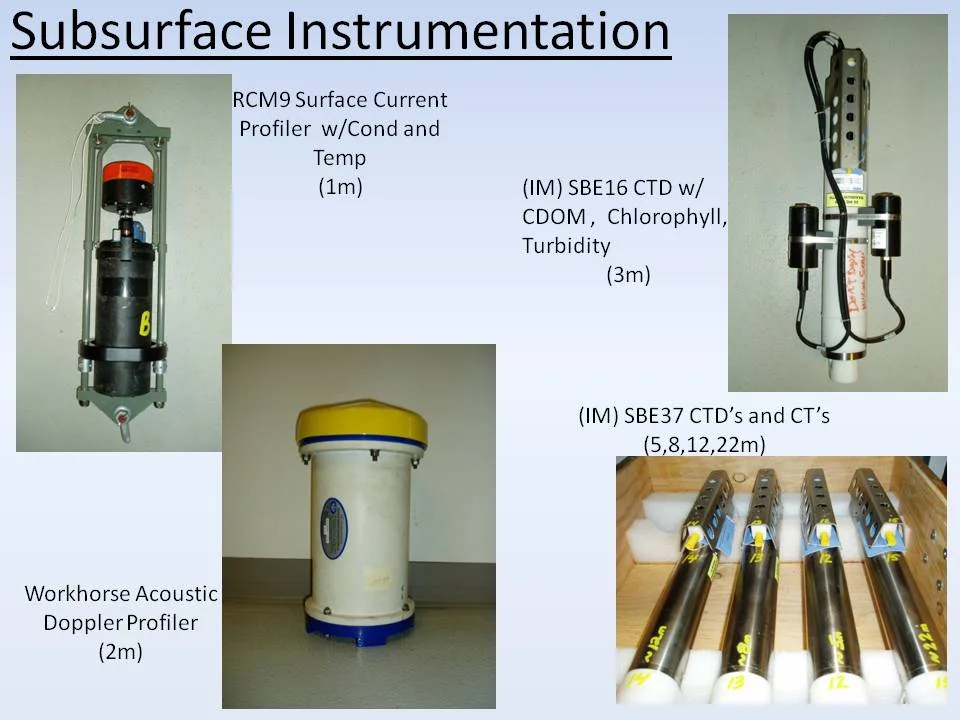
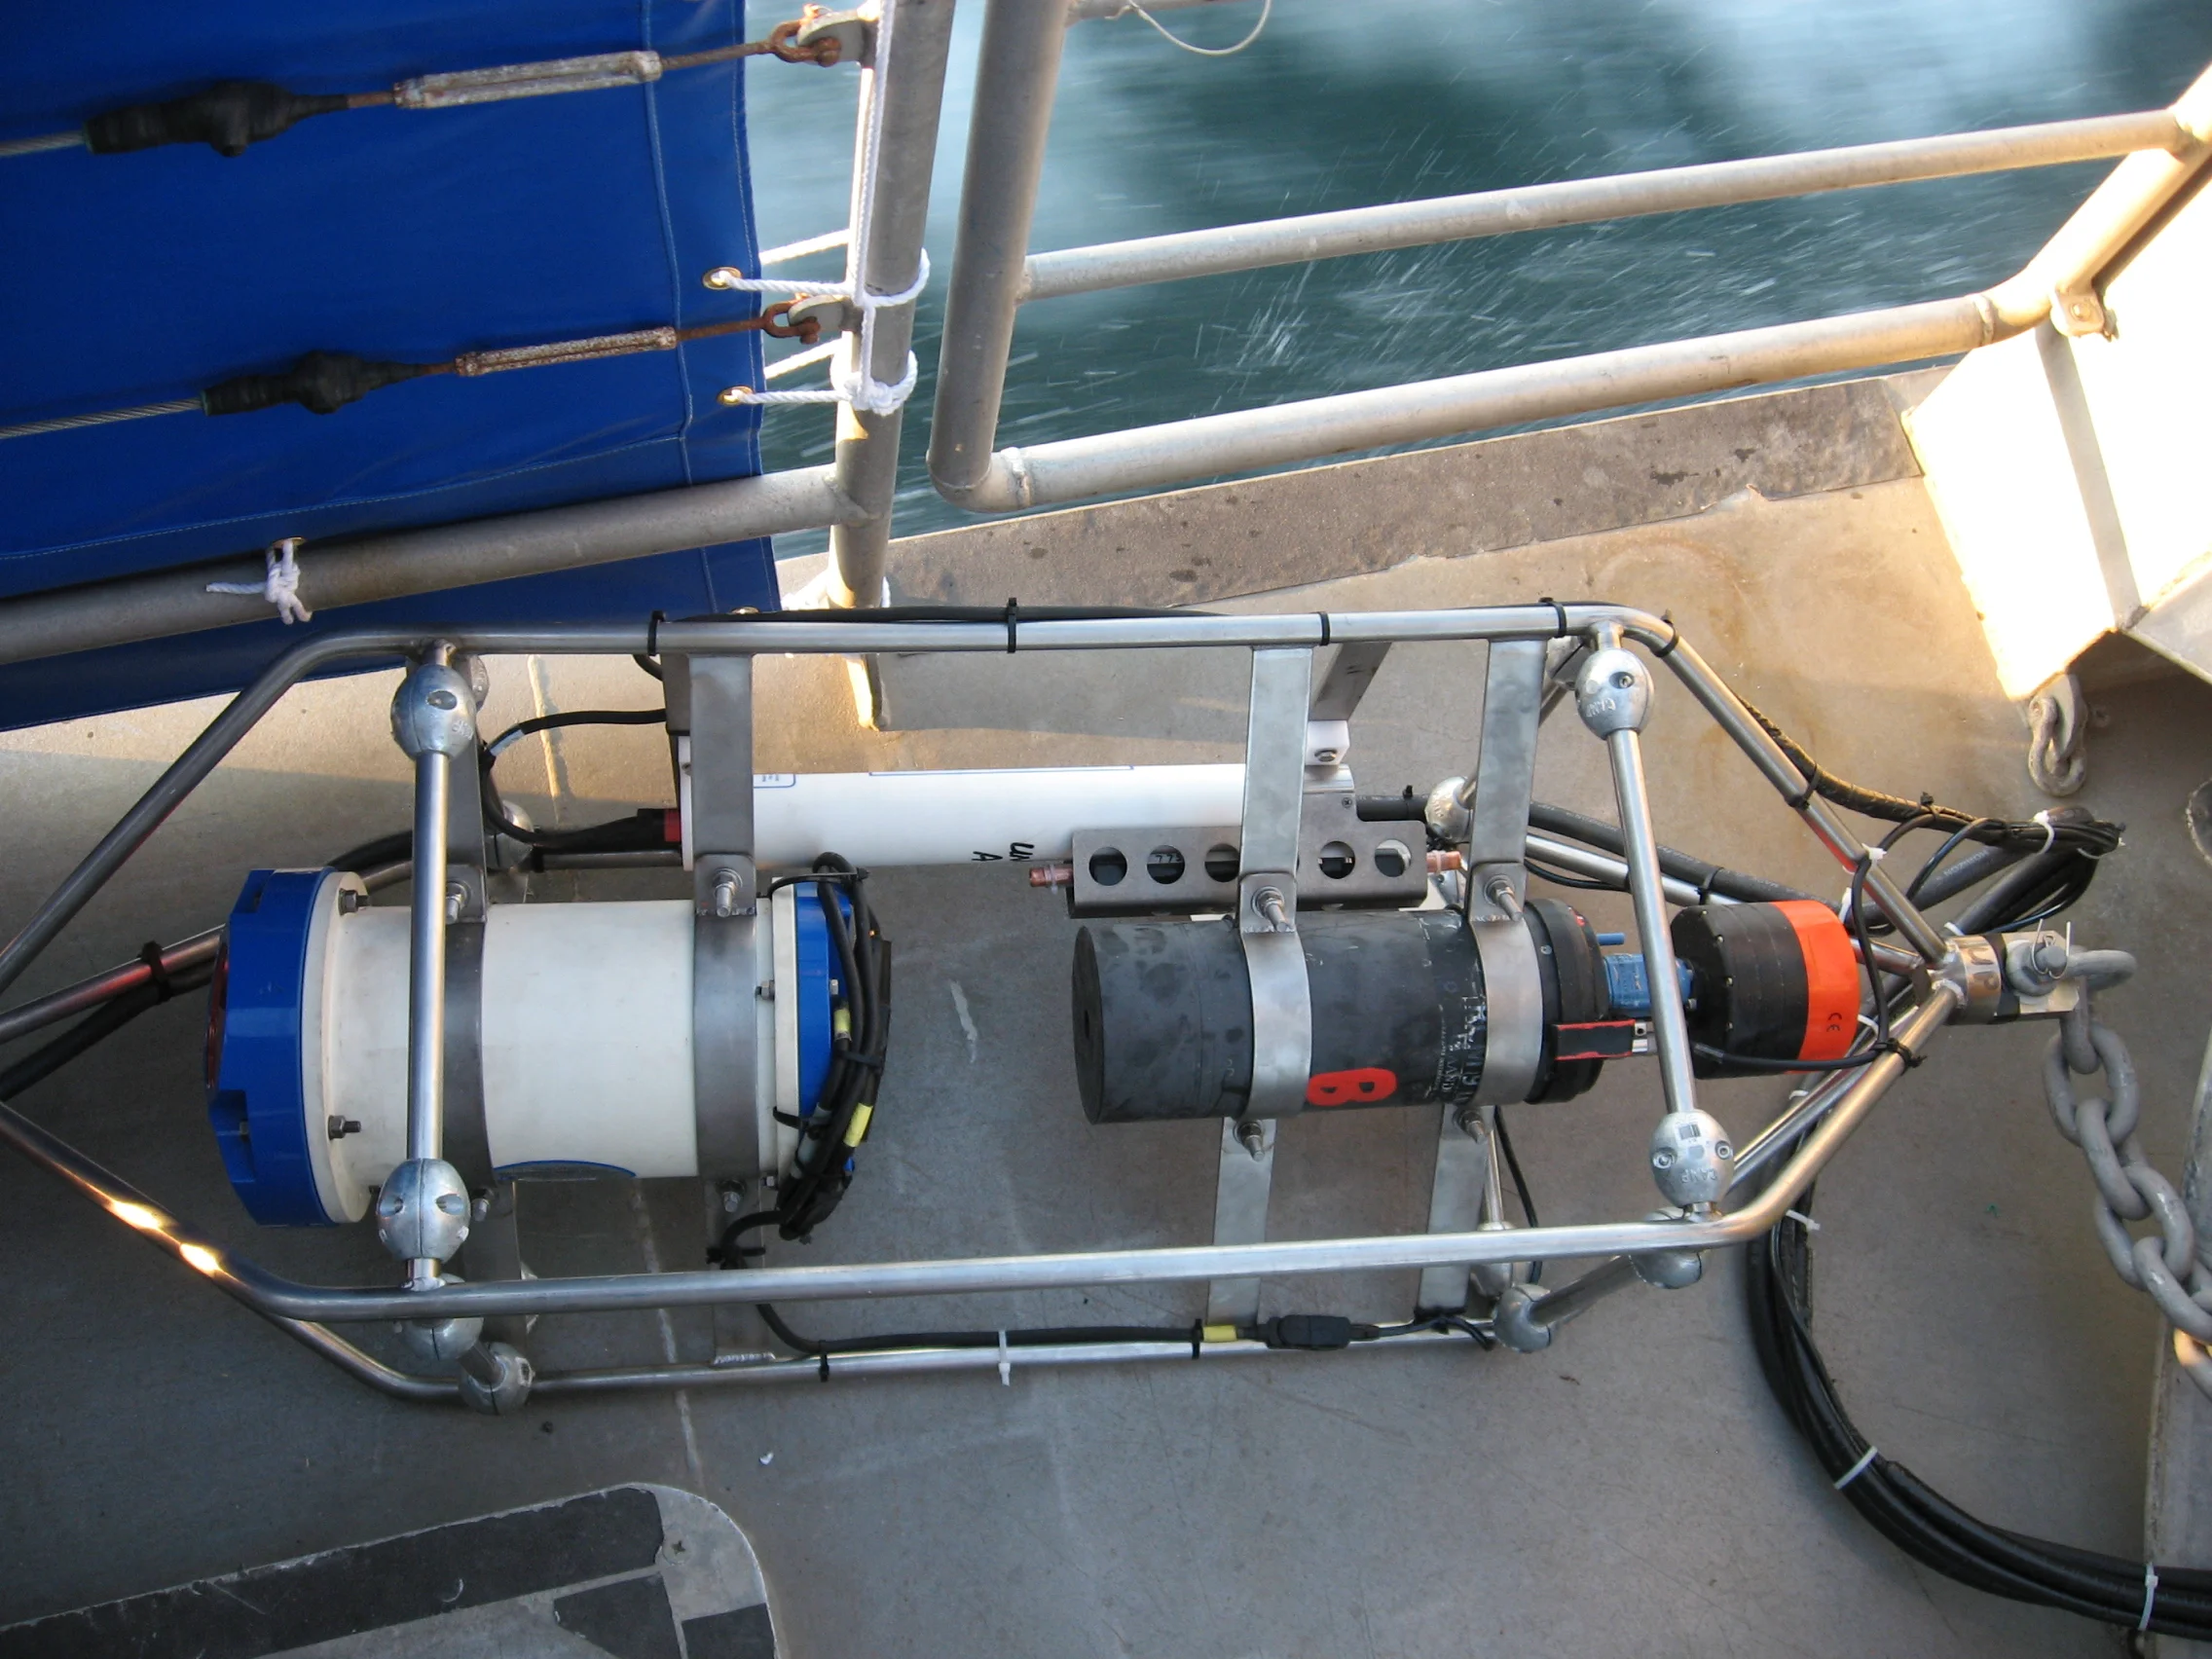
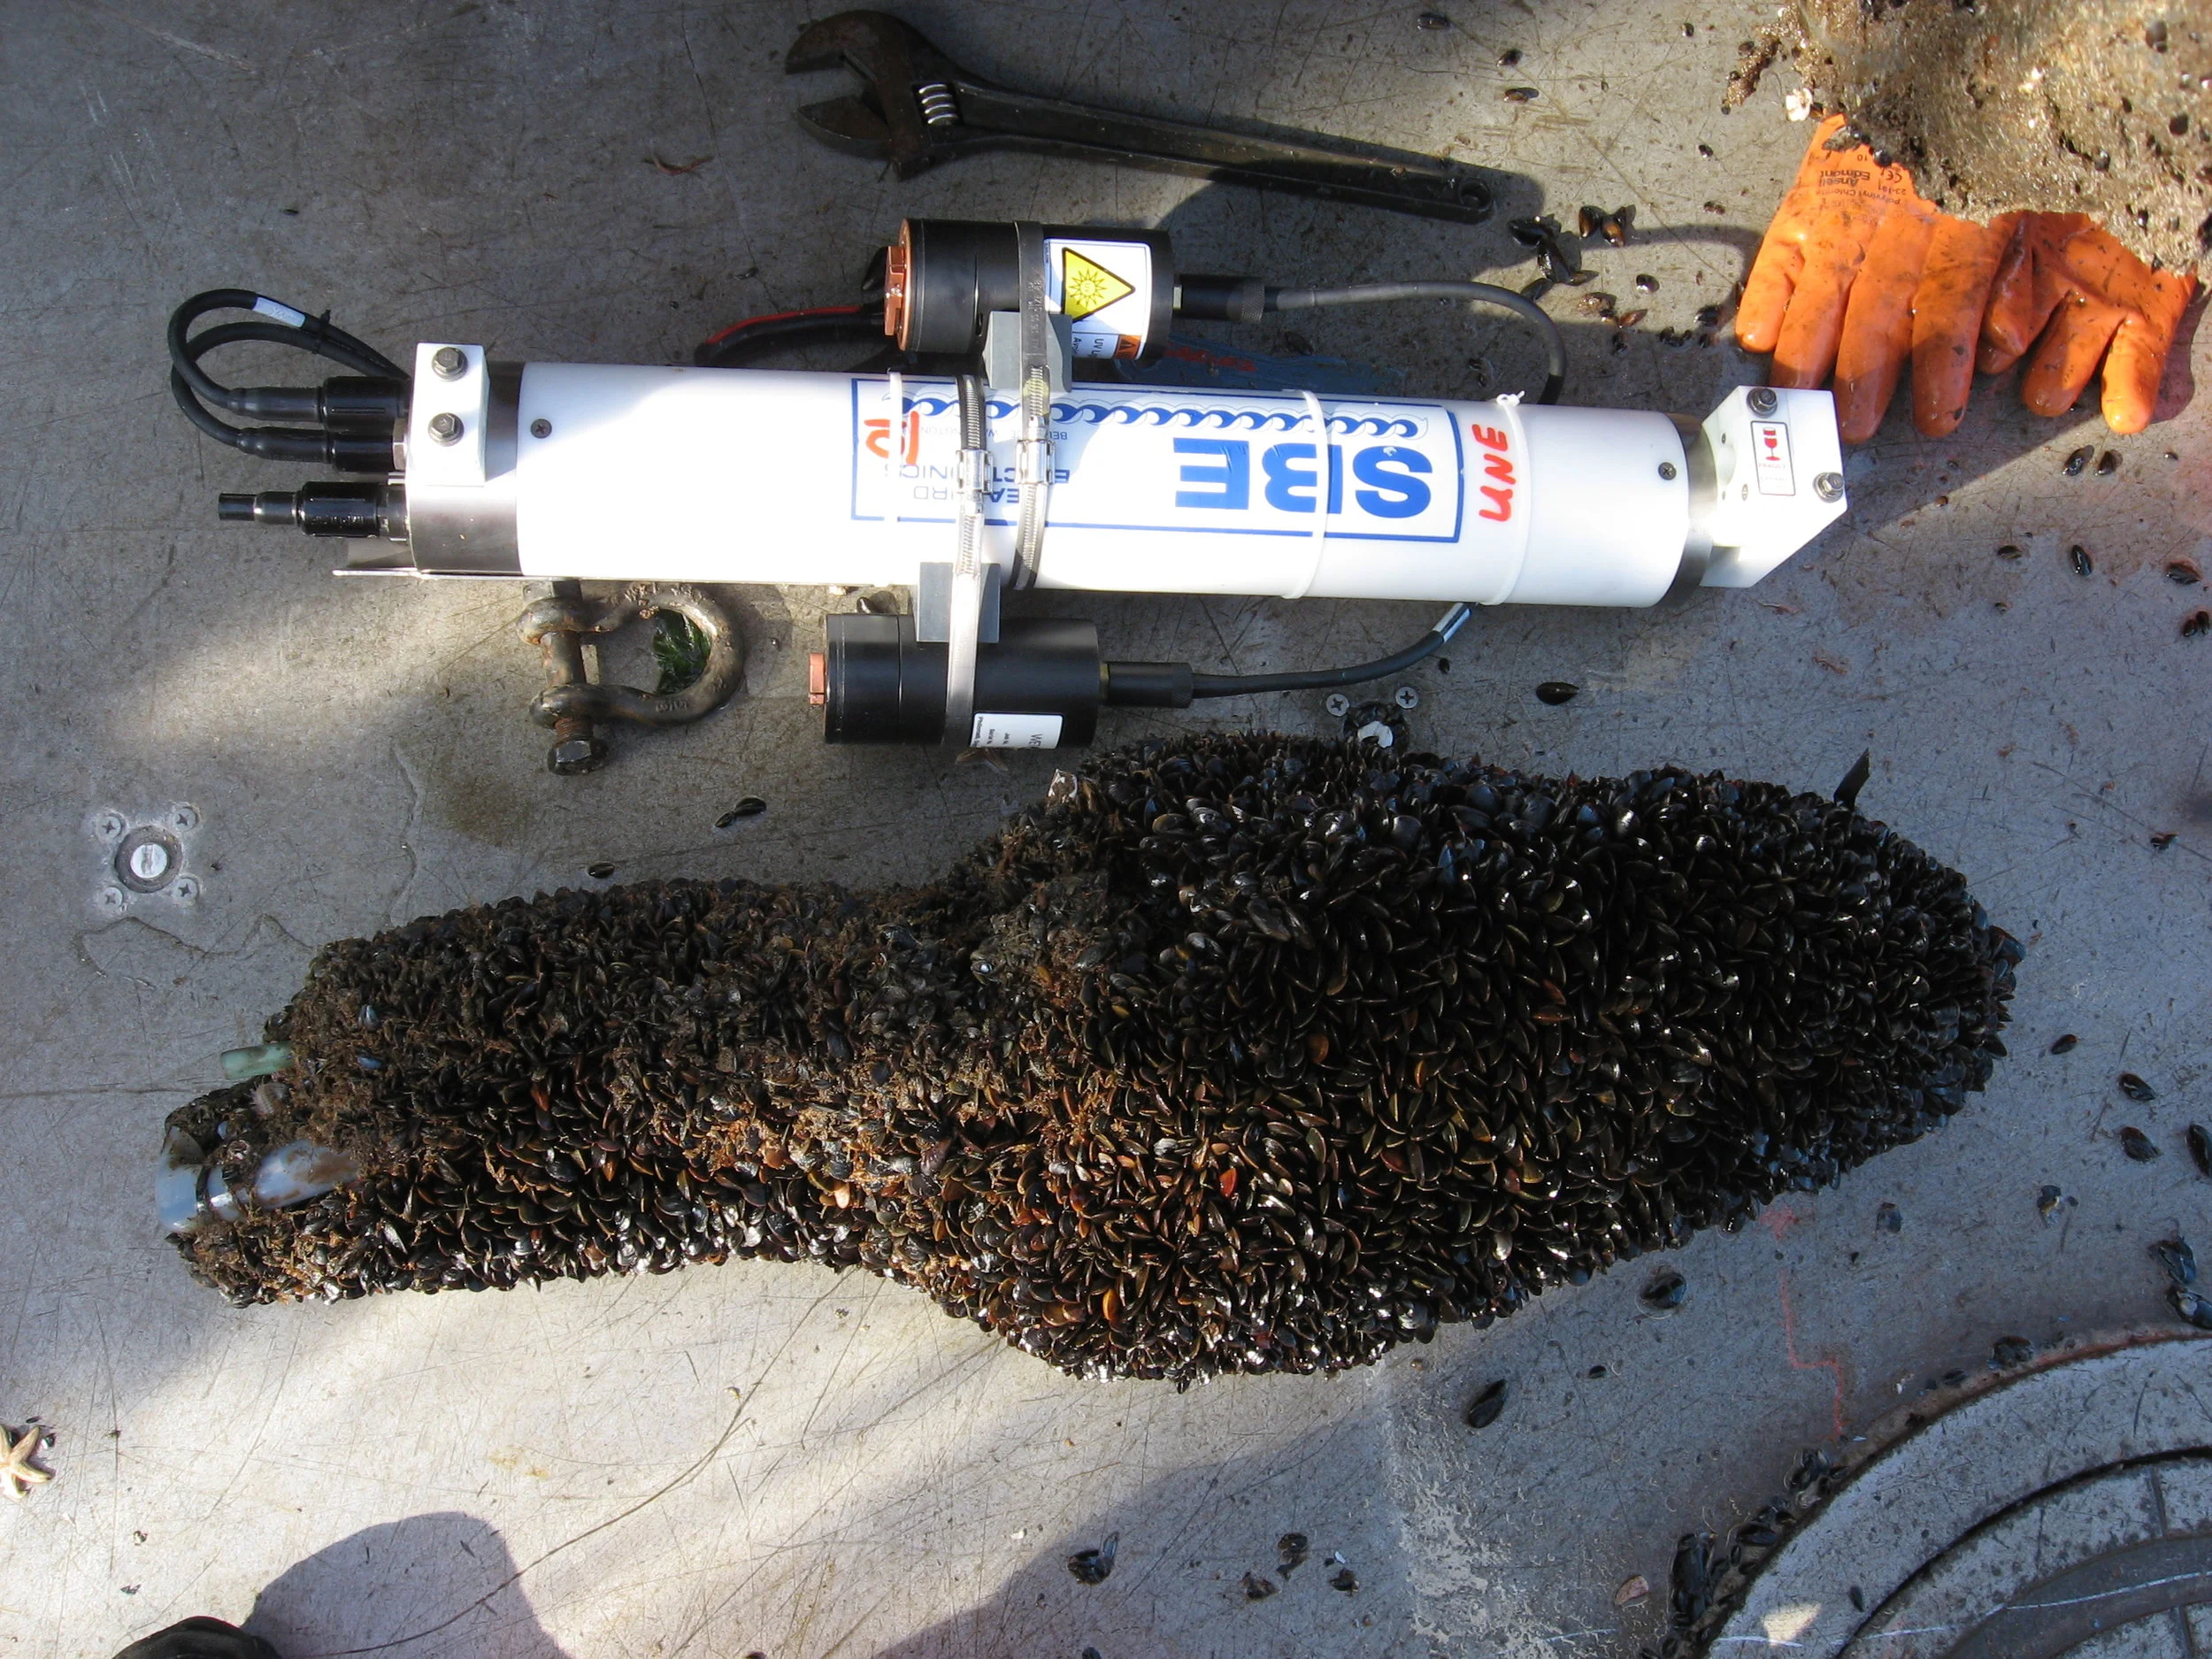
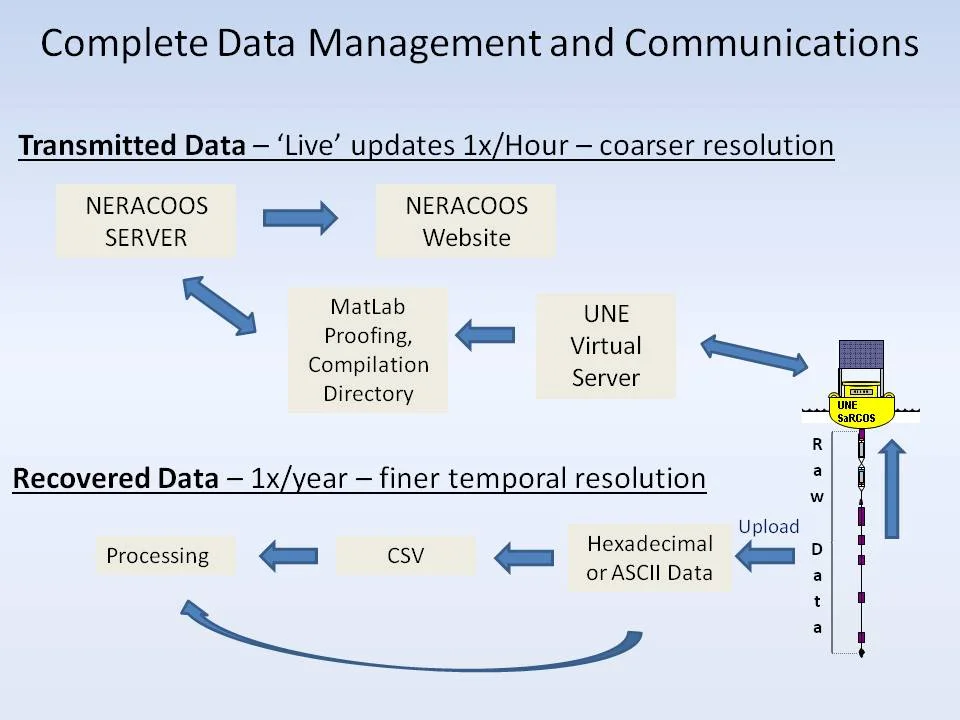
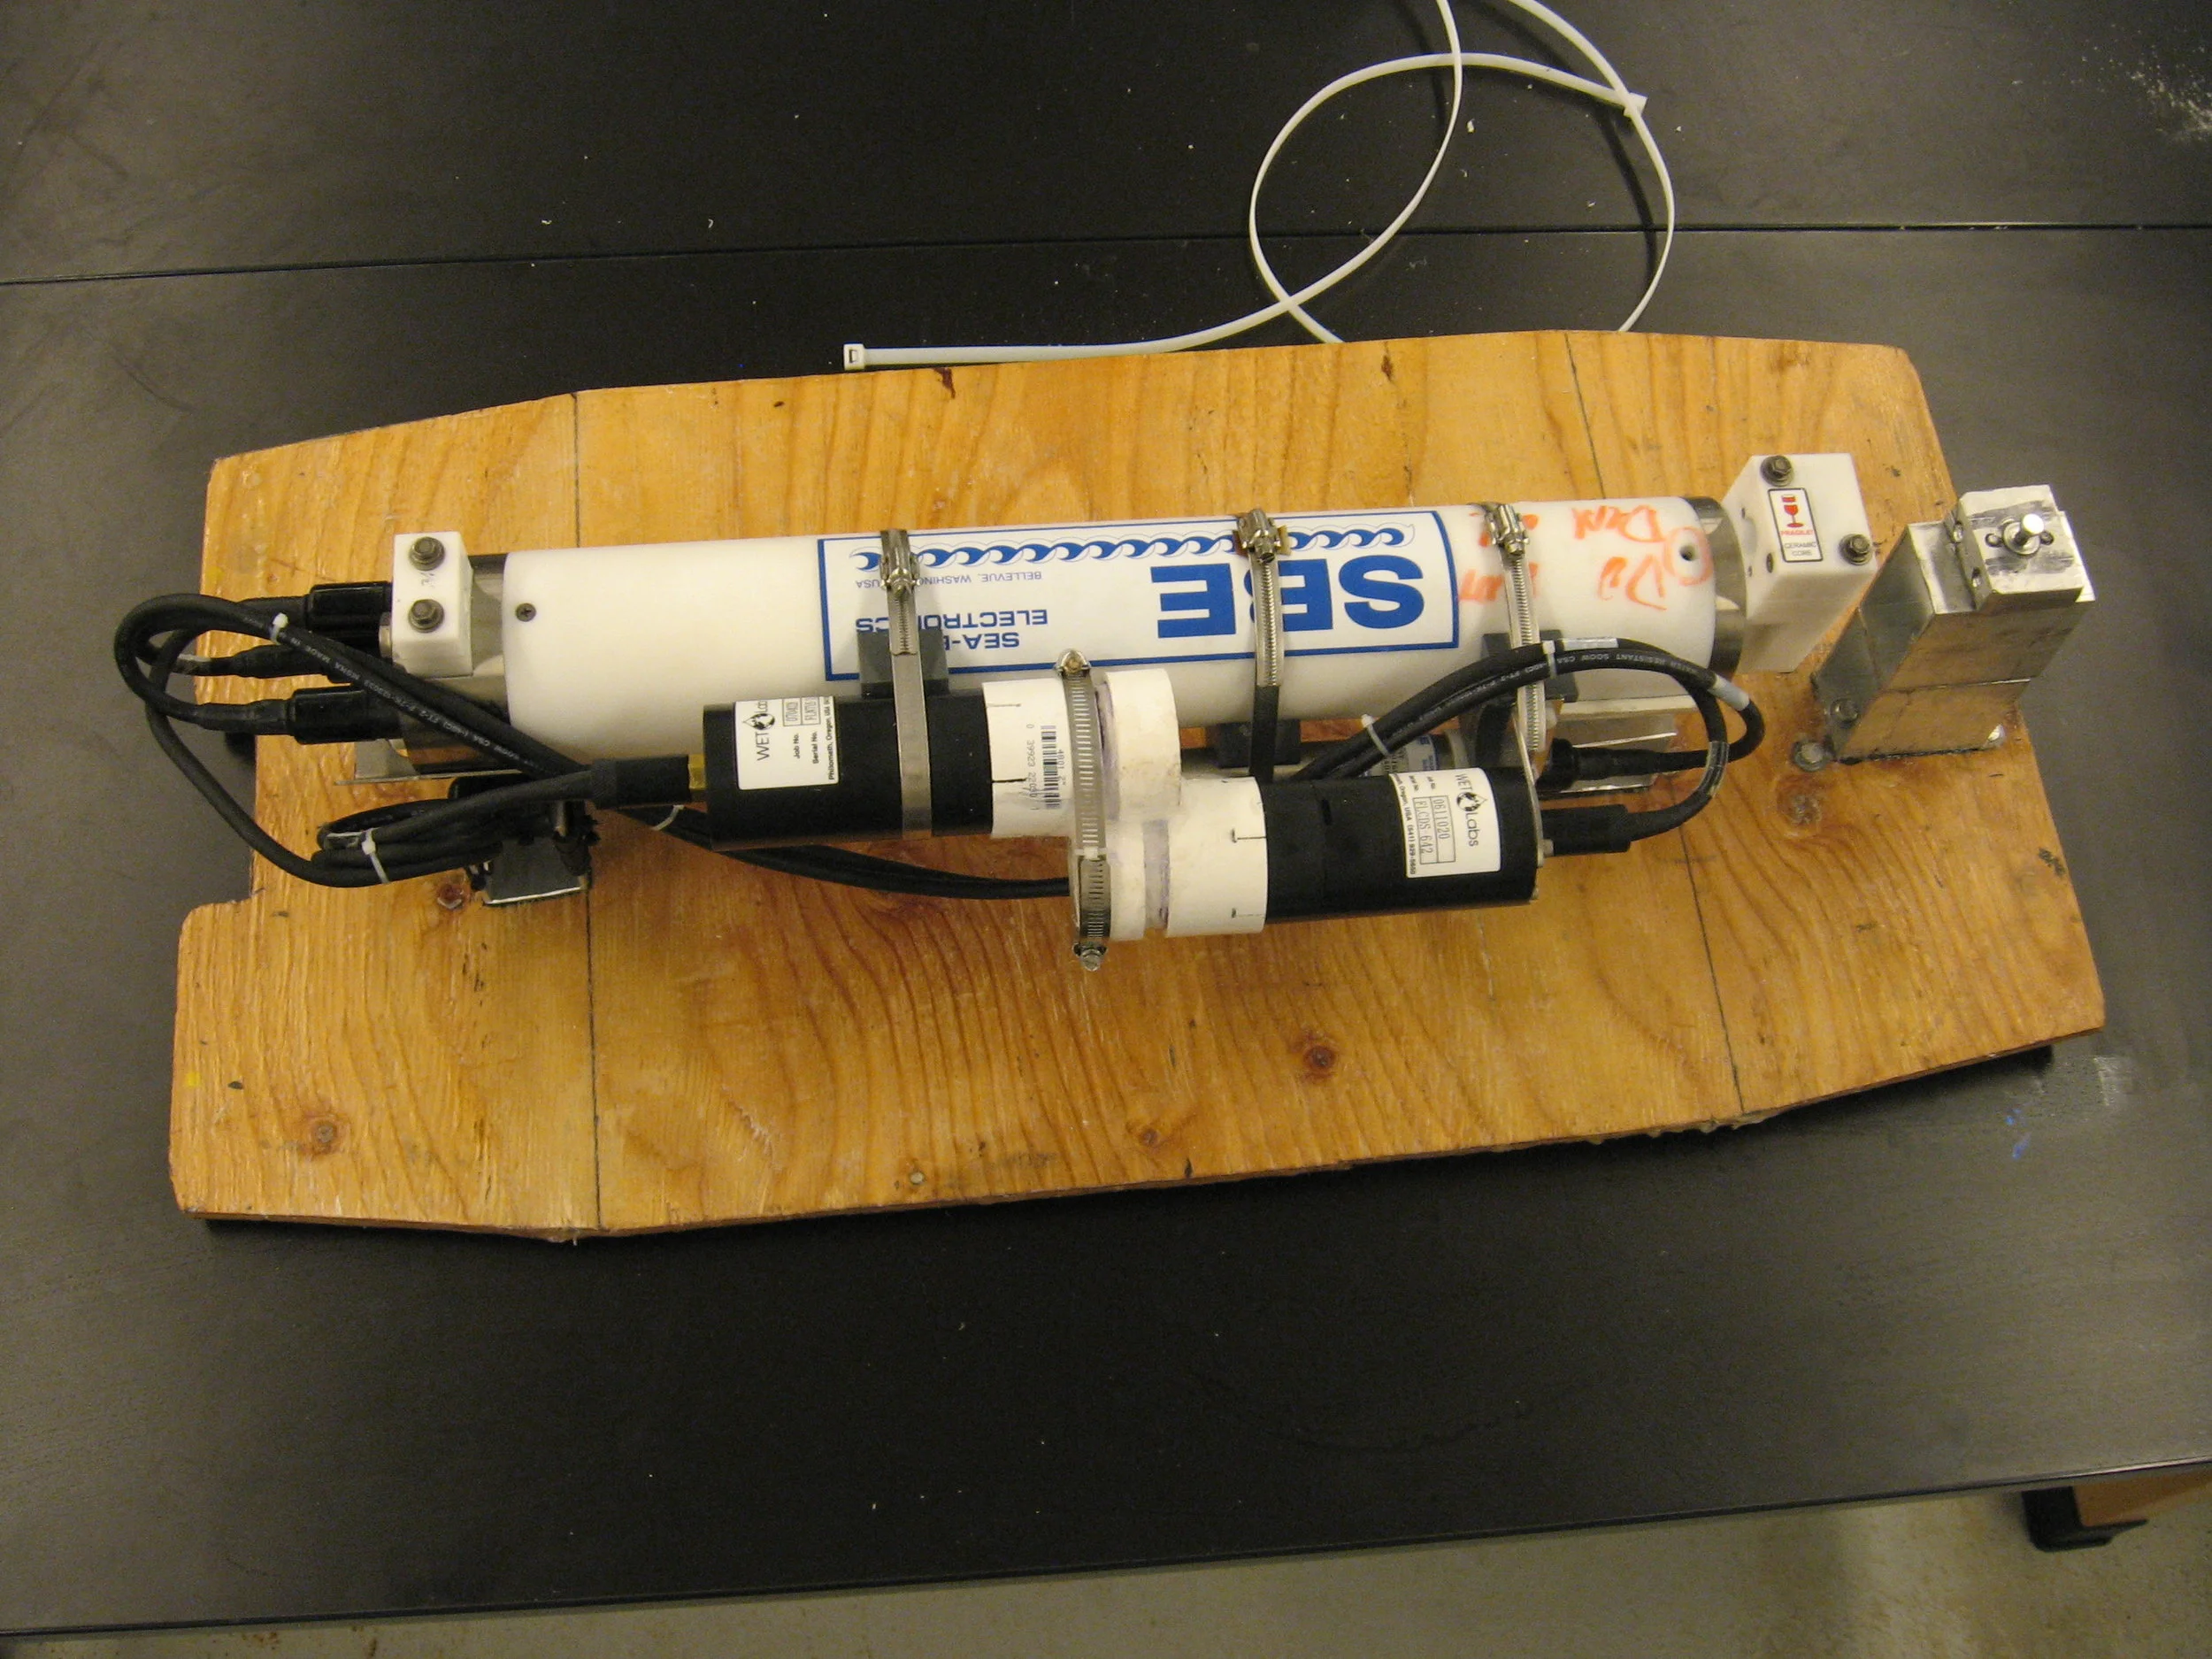
Offshore buoy sensors measured salinity and temperature at six different depths, vertical and horizontal current profile, chlorophyll, wave parameters, and wind speed and direction. Data transmitted in near-real time from the buoy was available to the scientific community through the GoMOOS network.

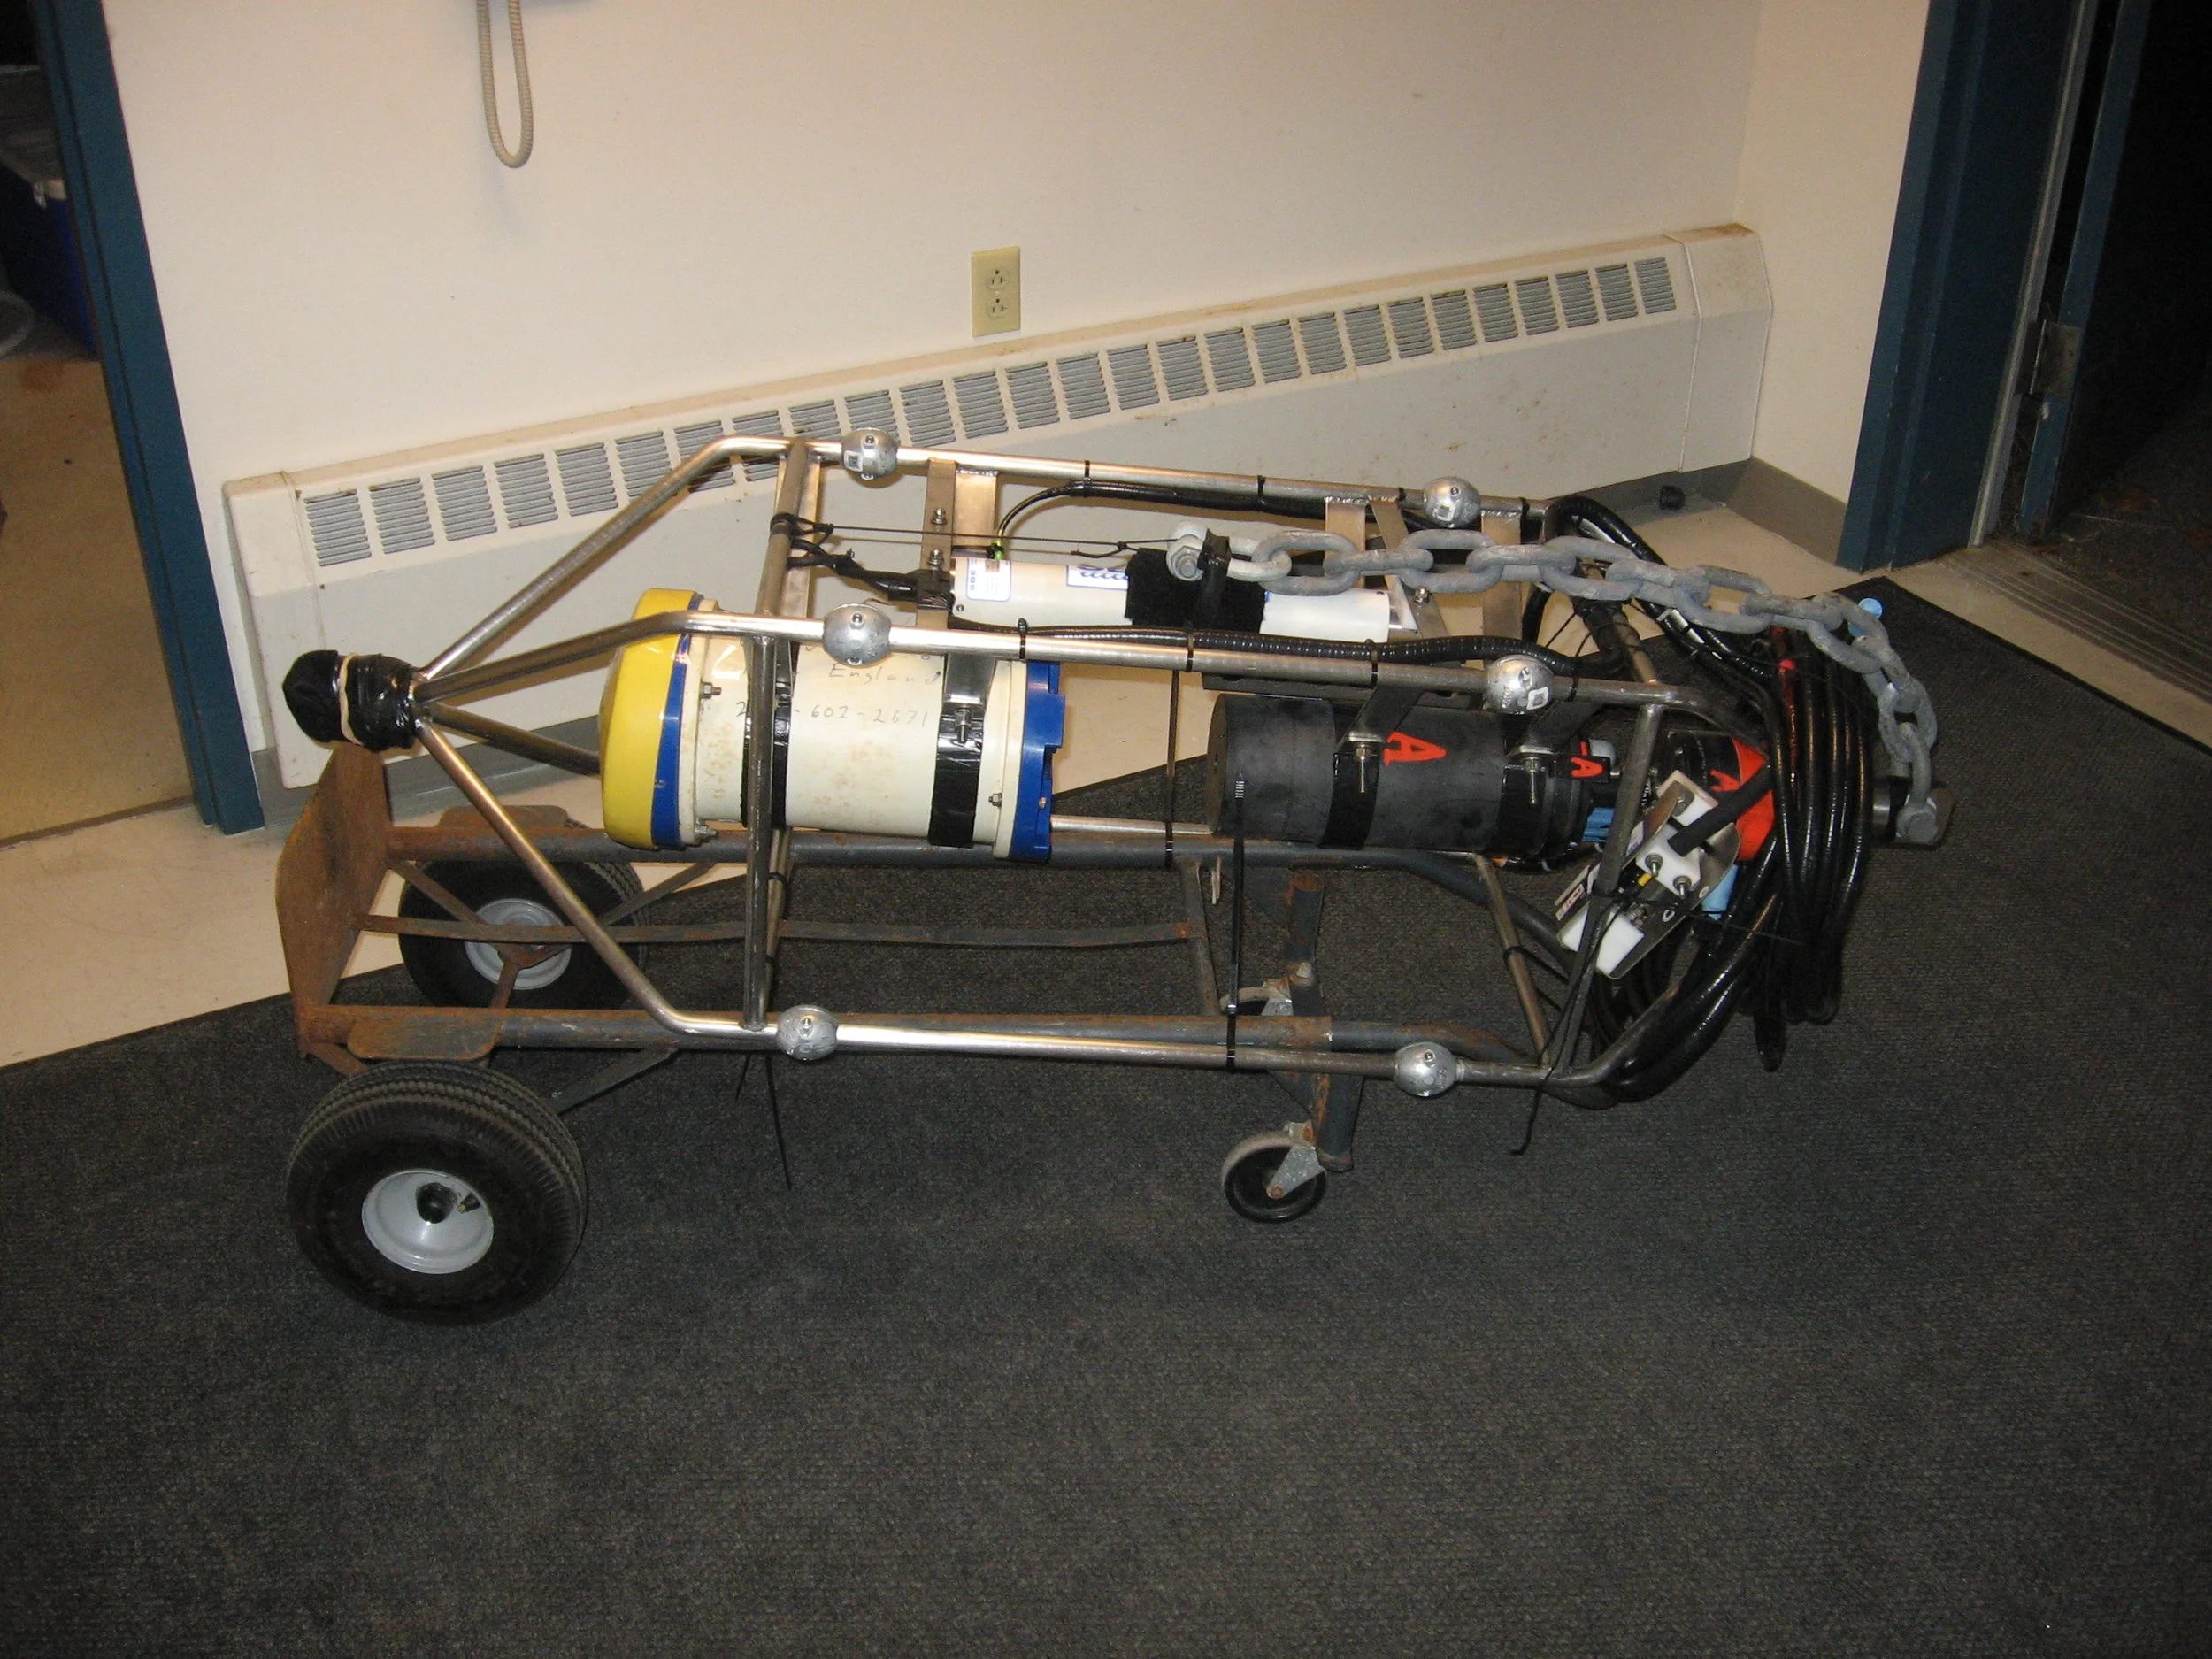
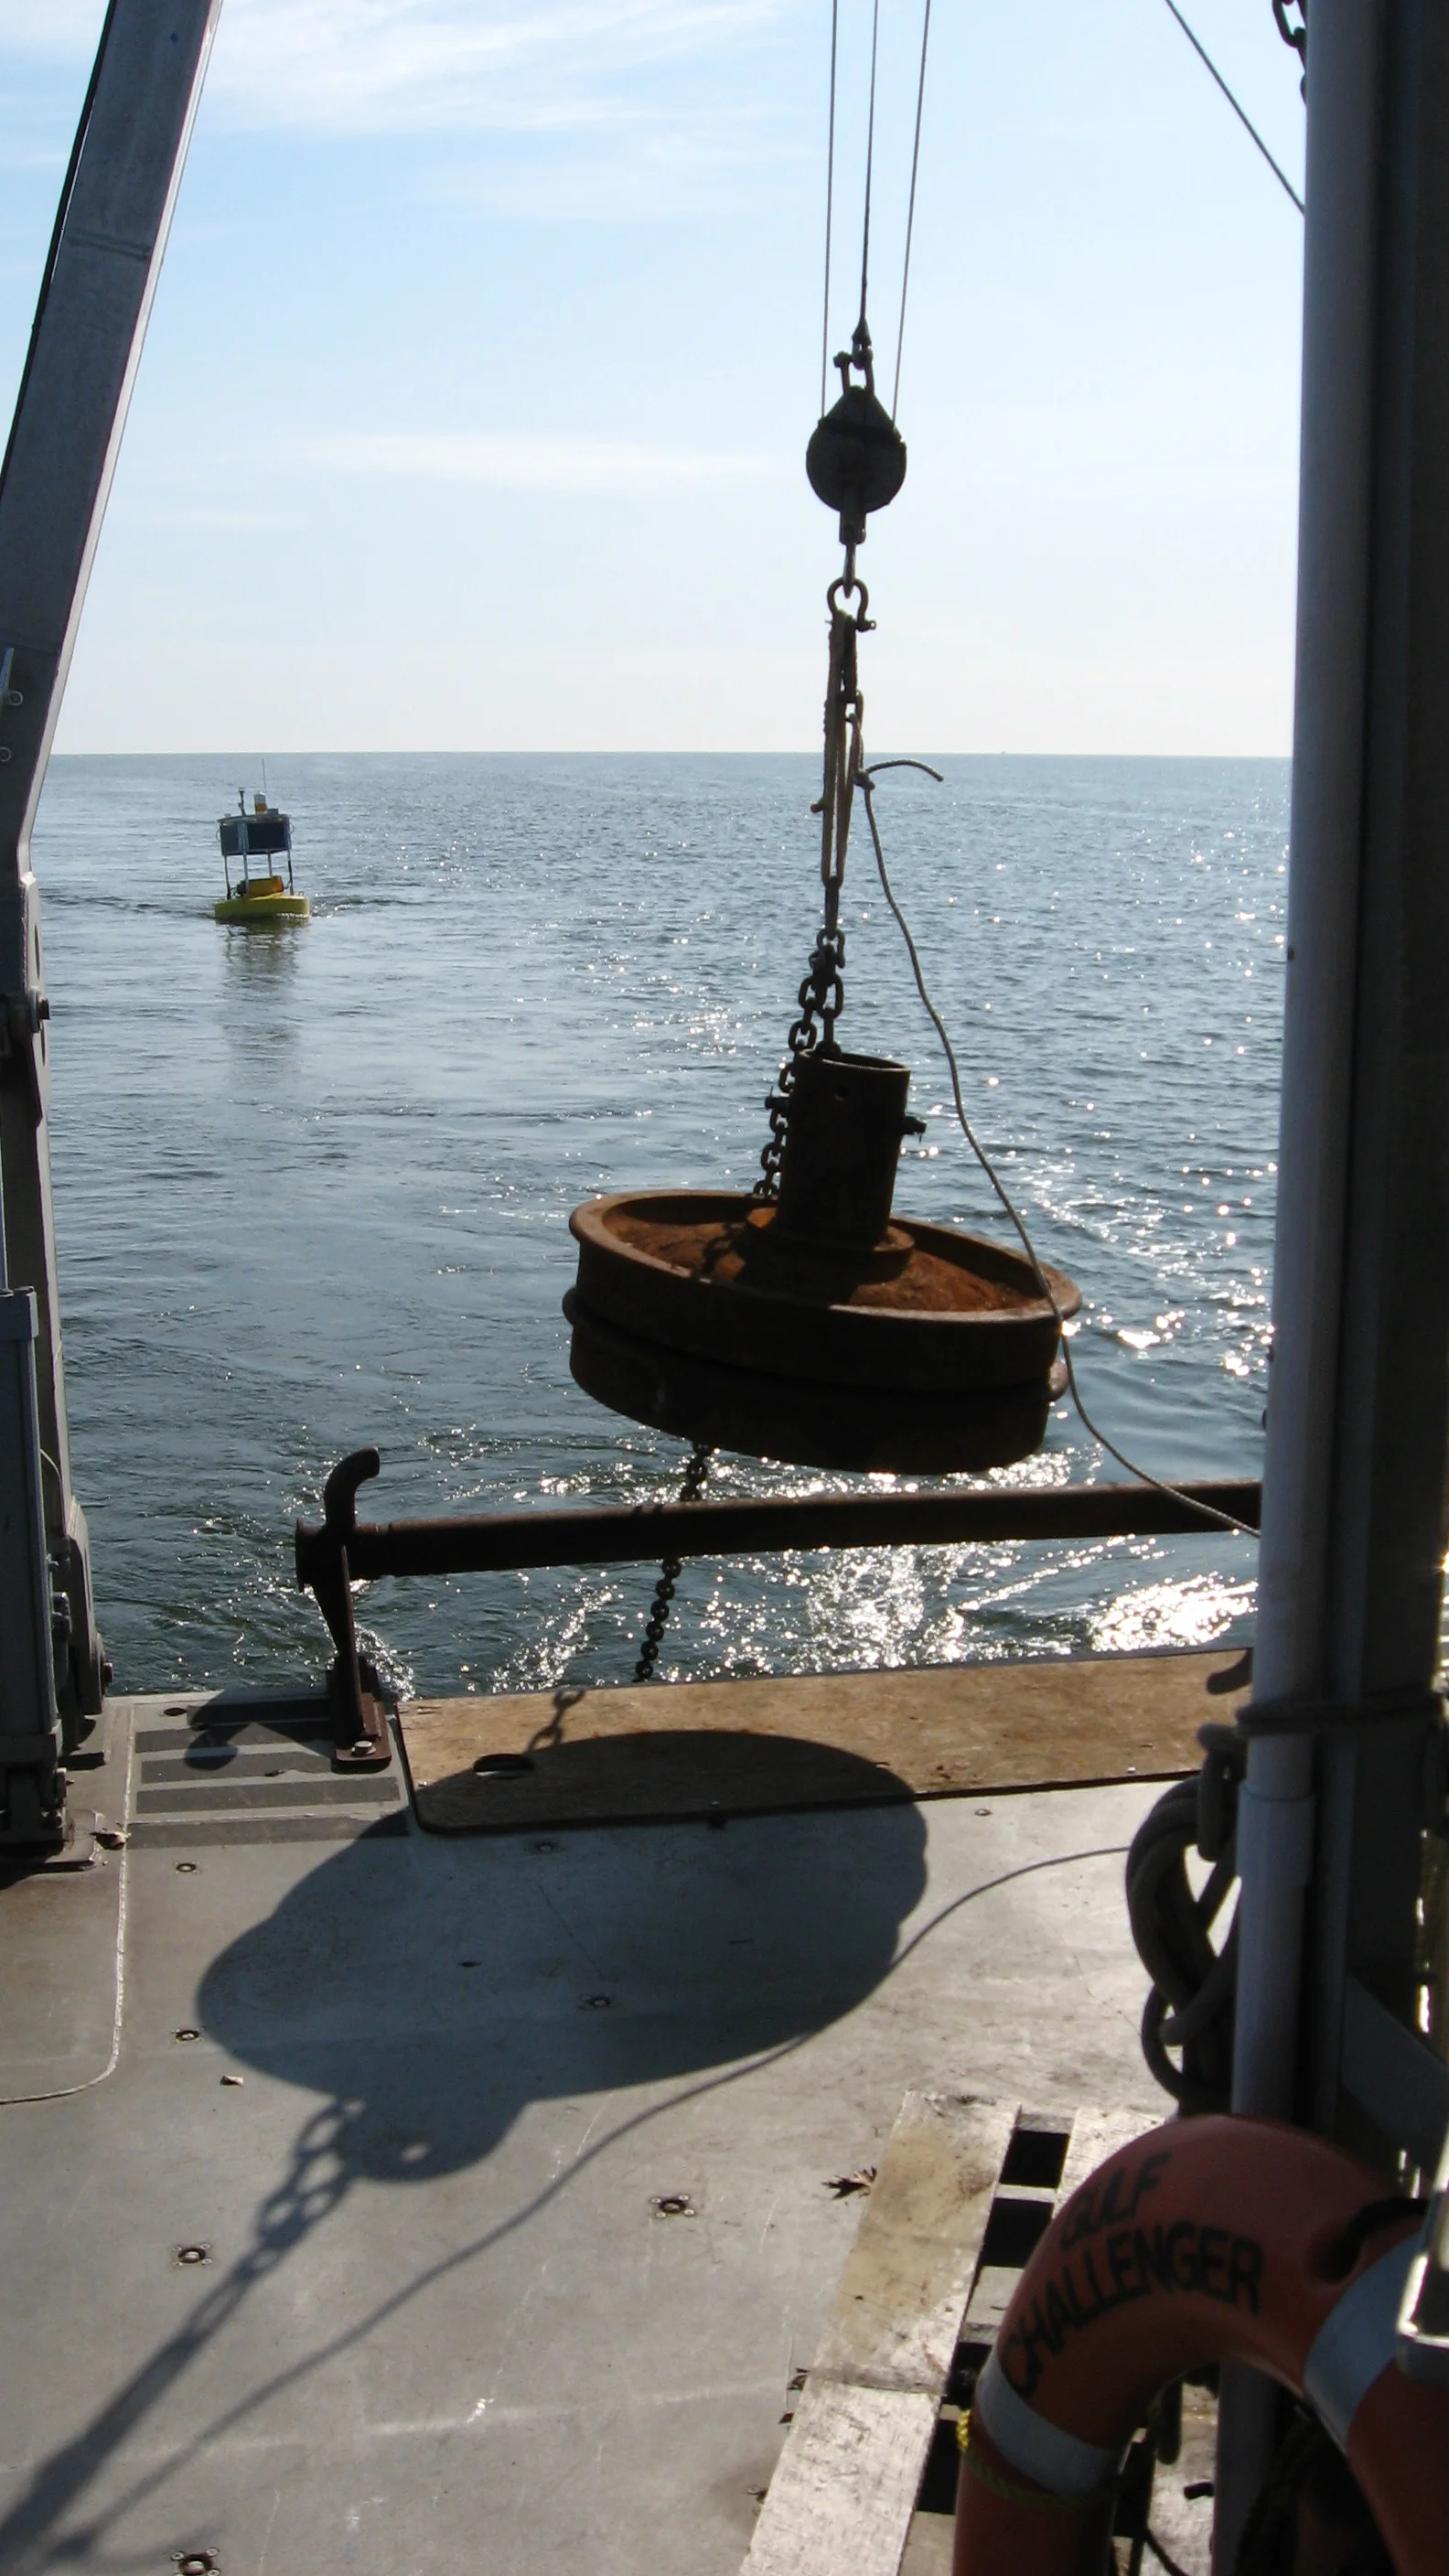
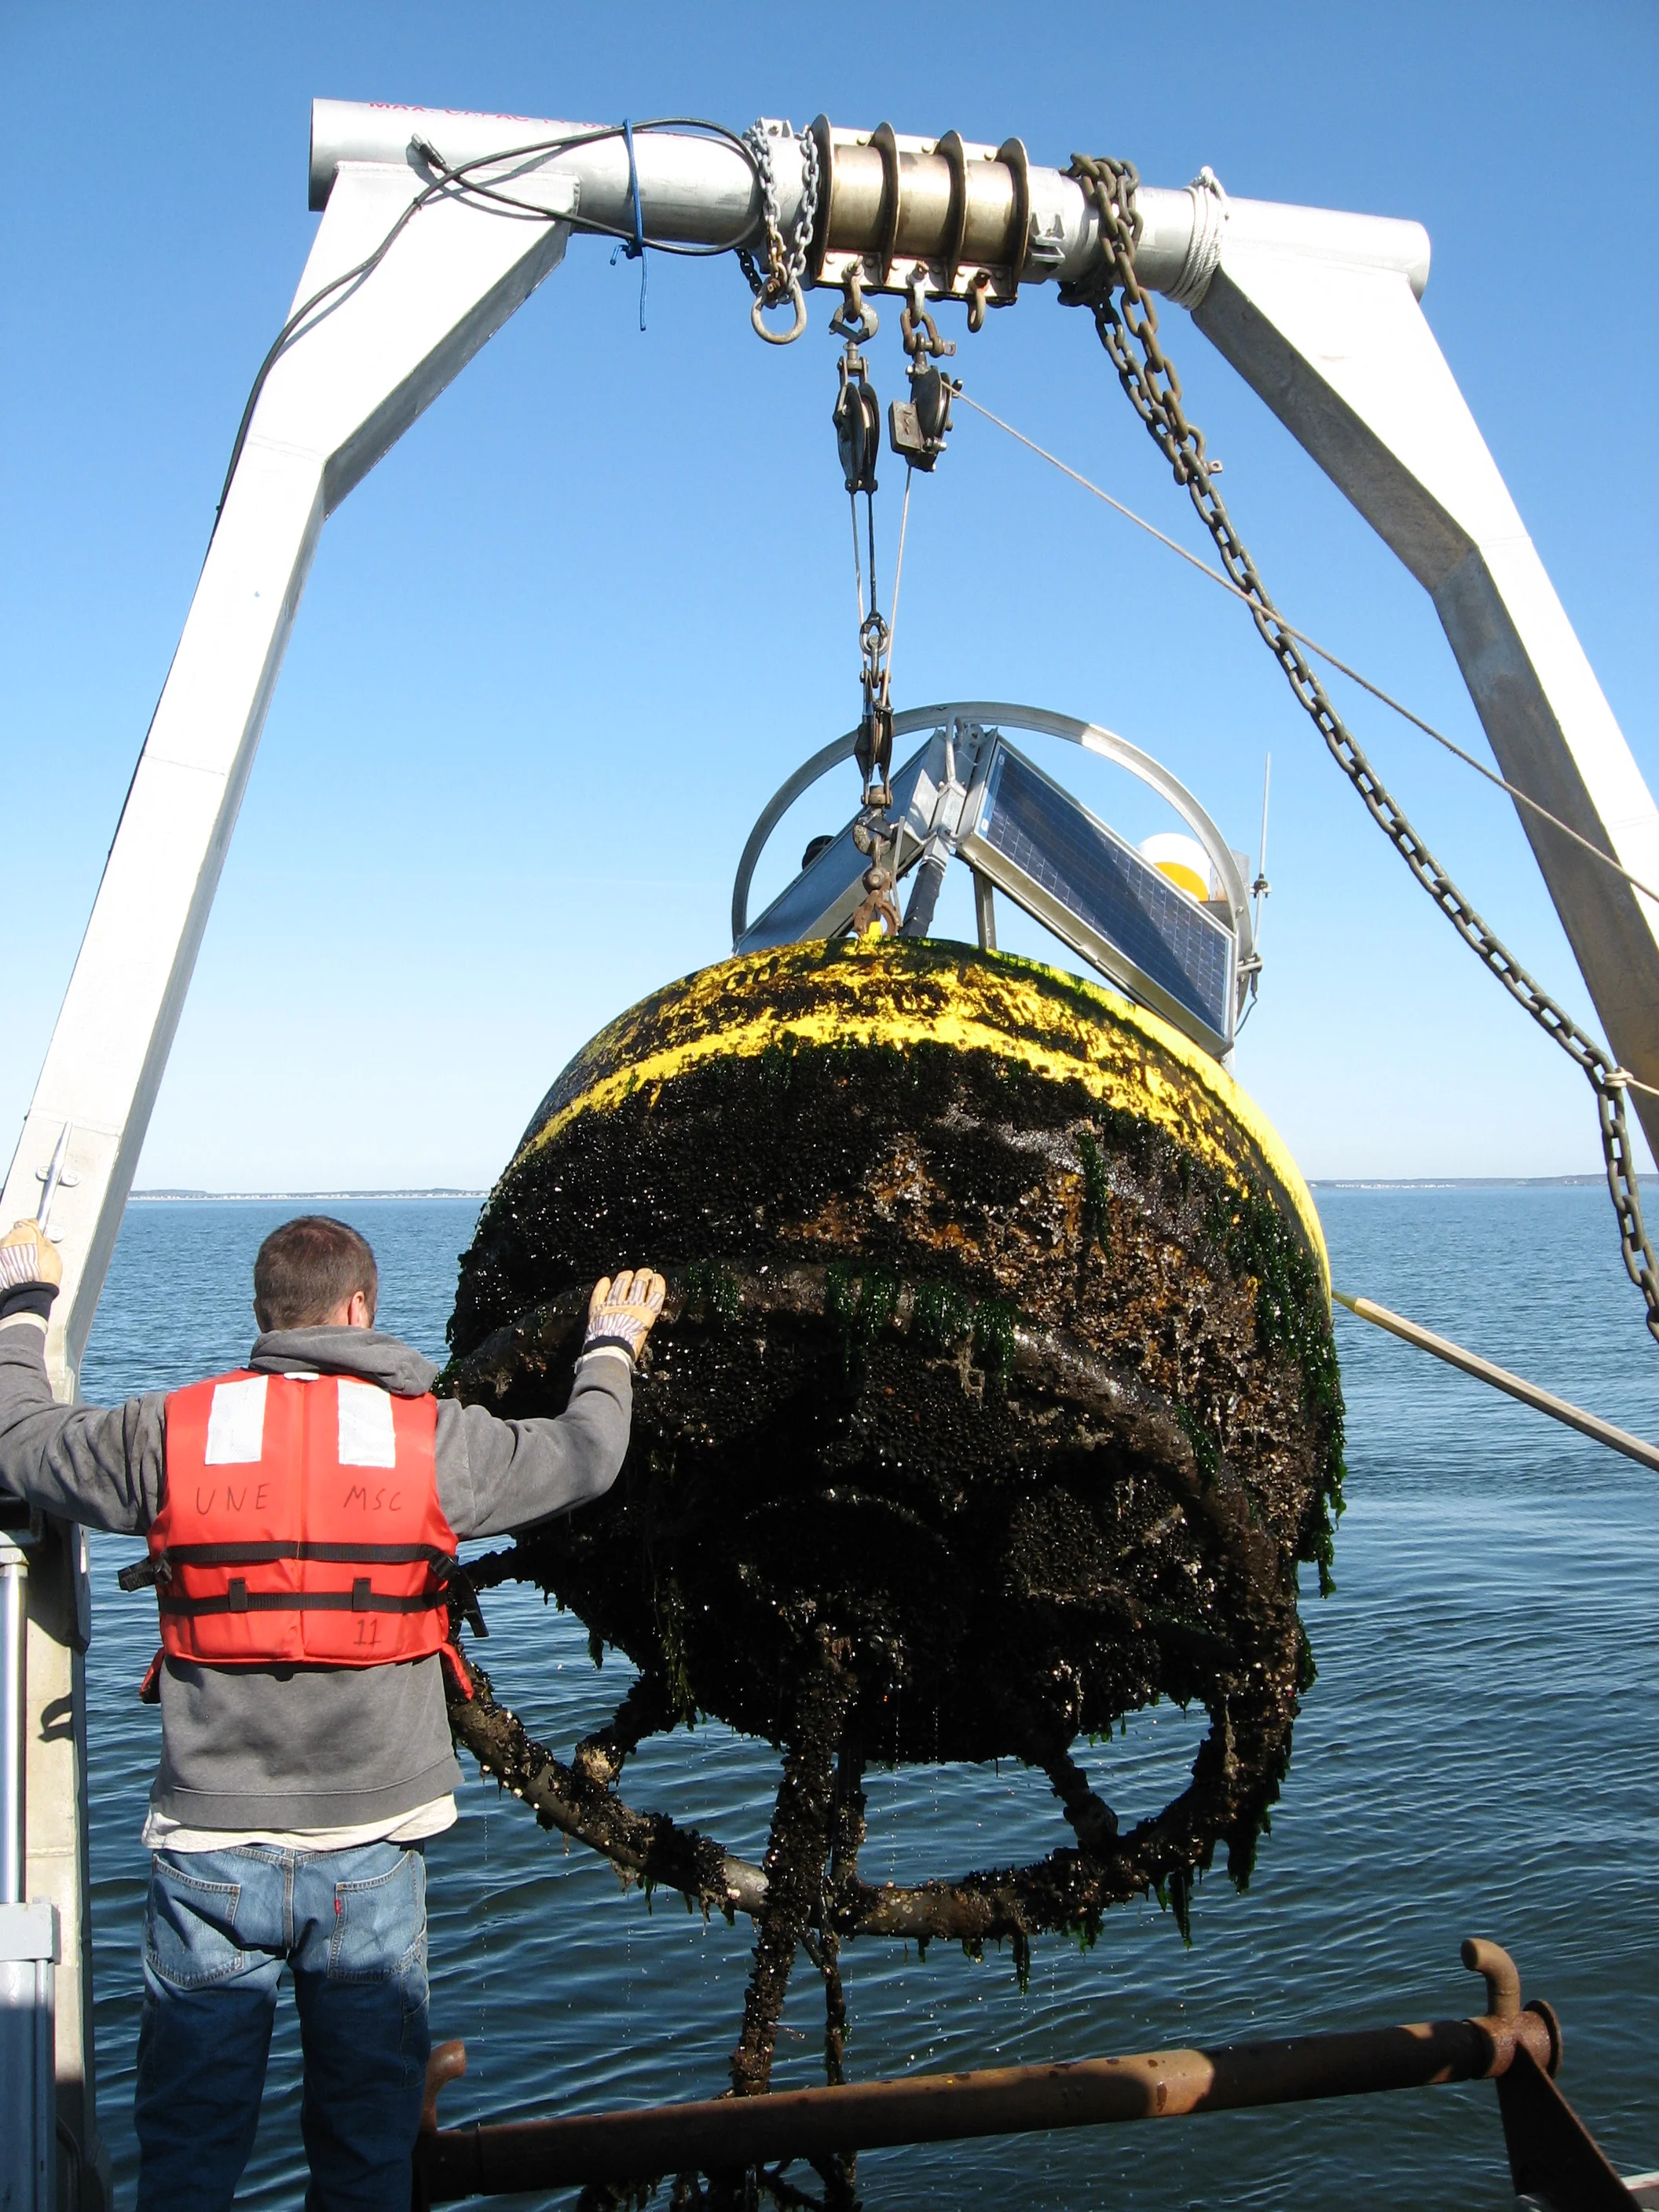
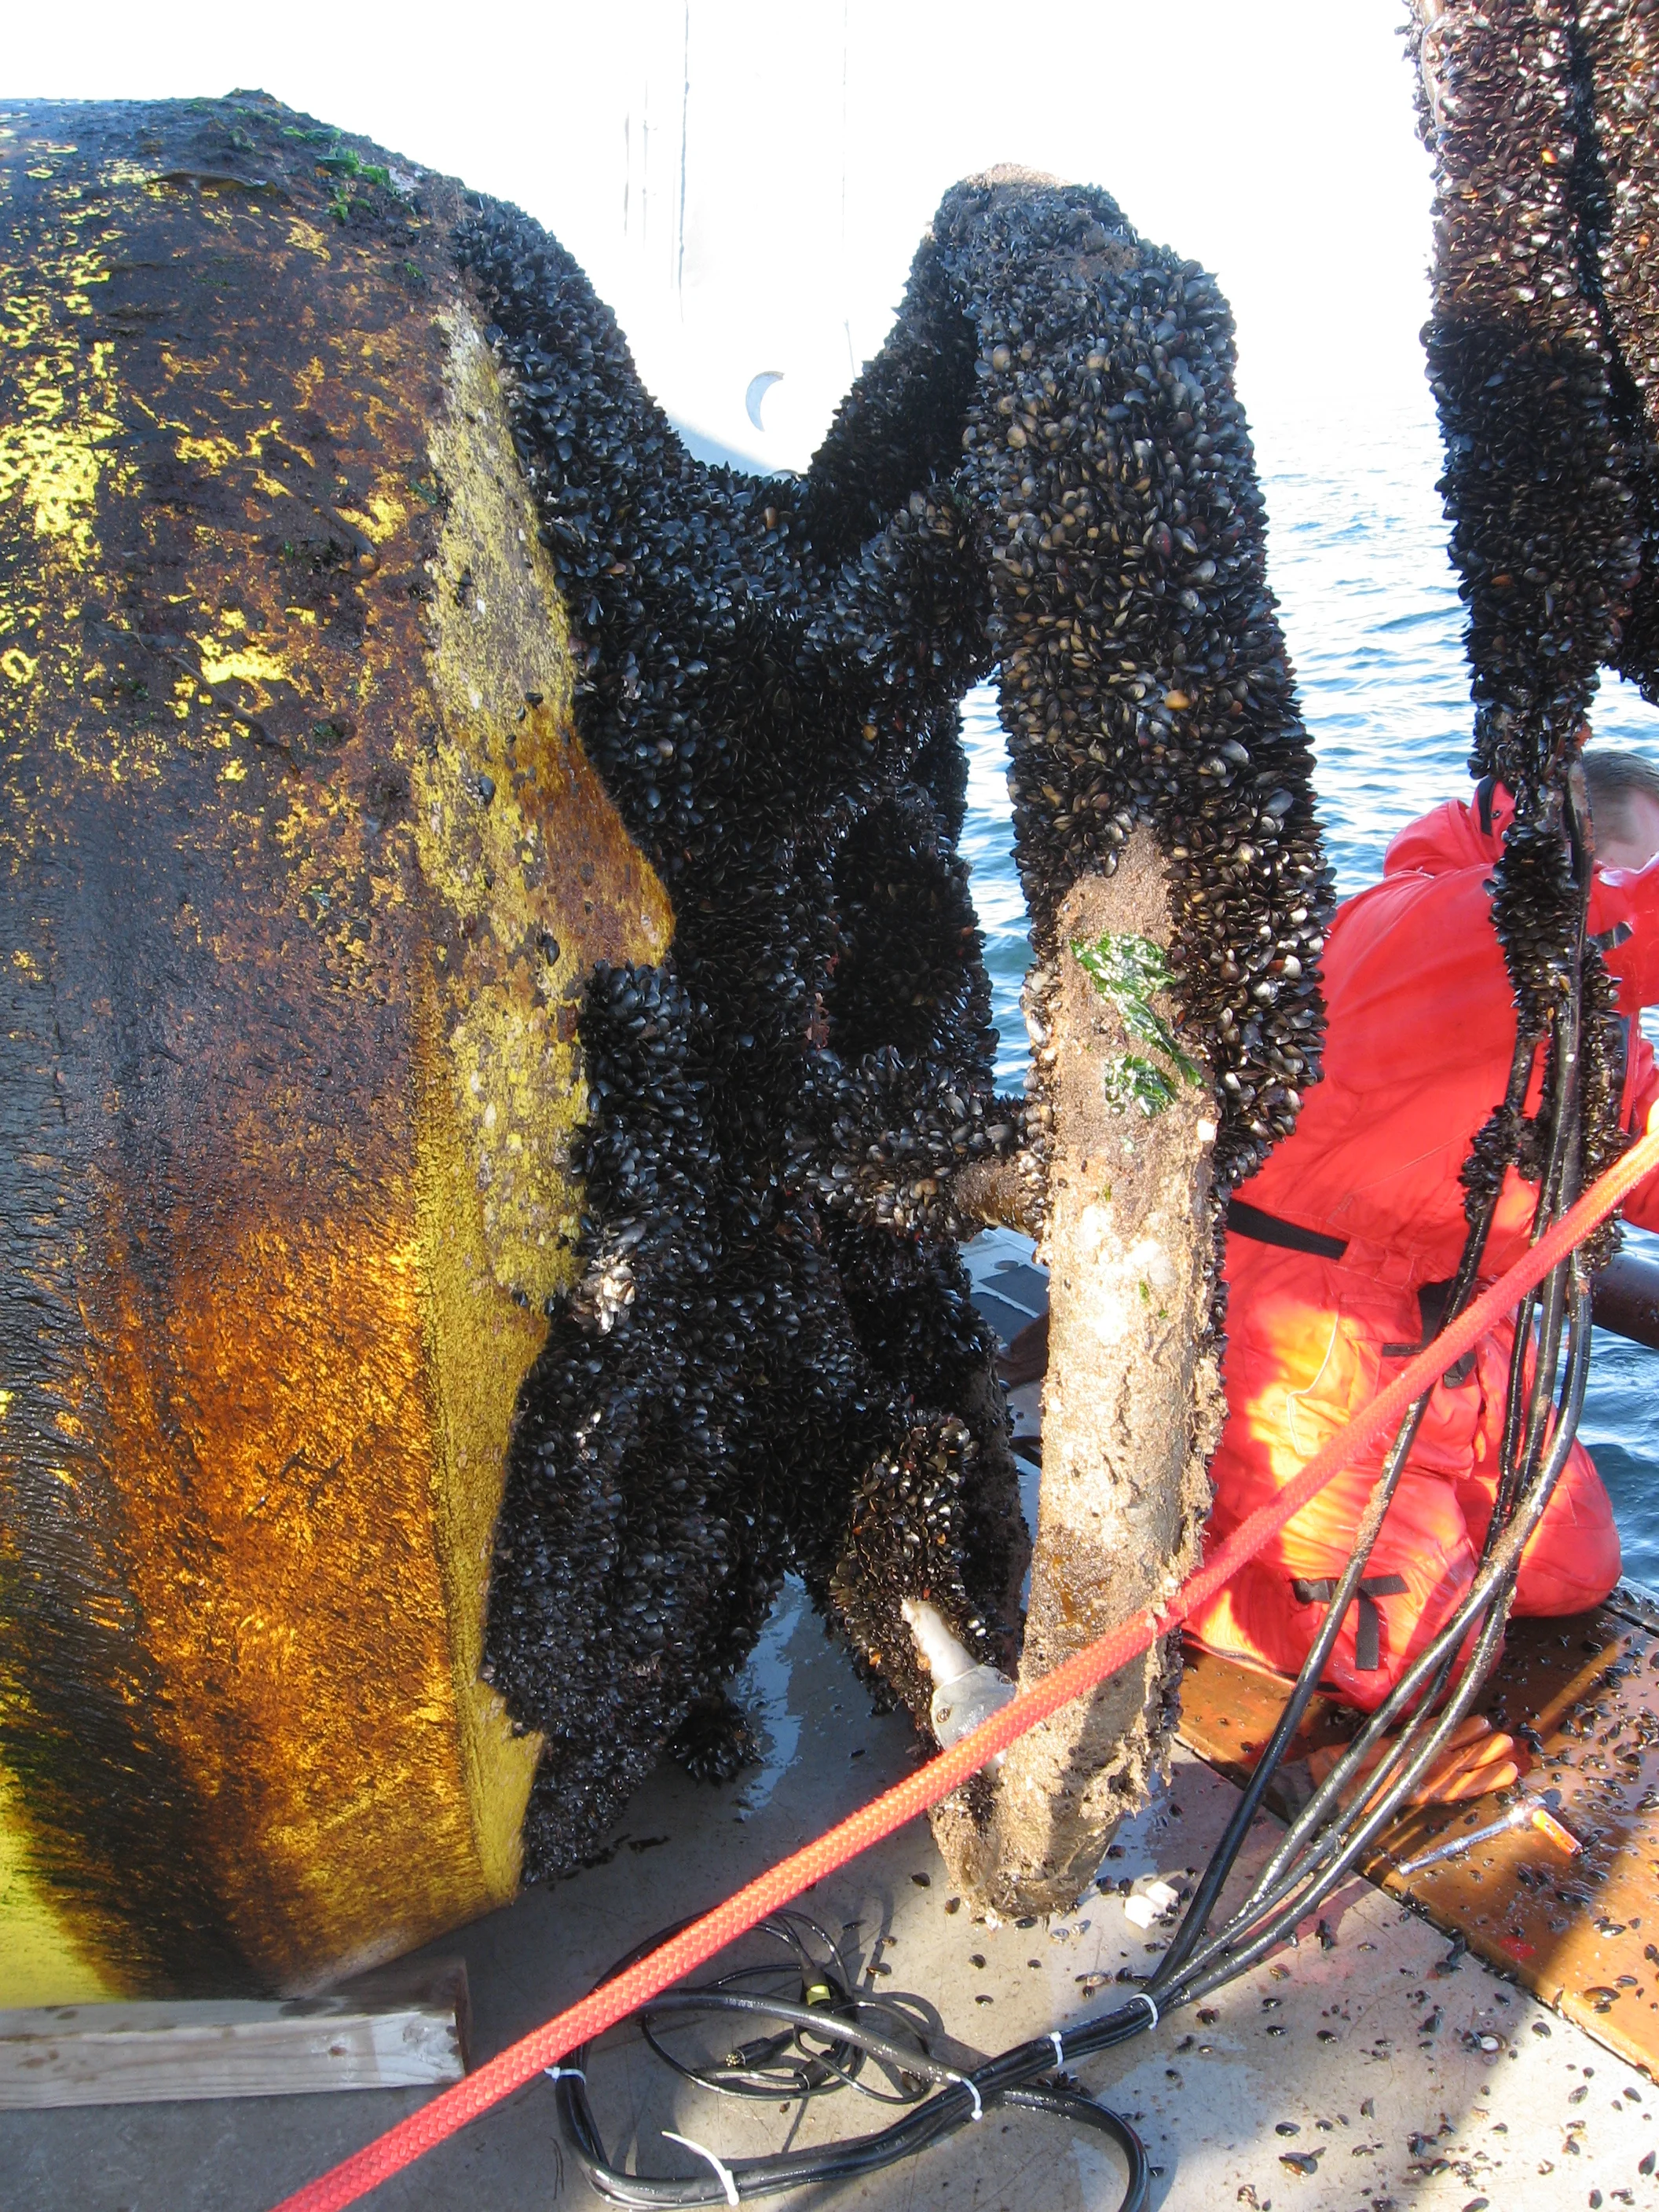
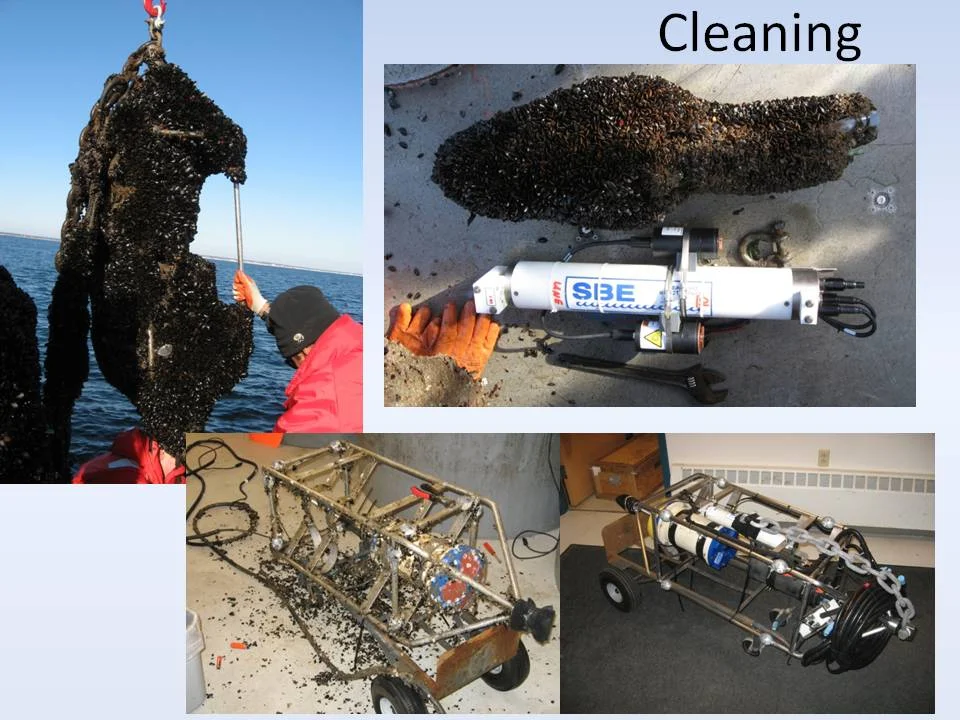
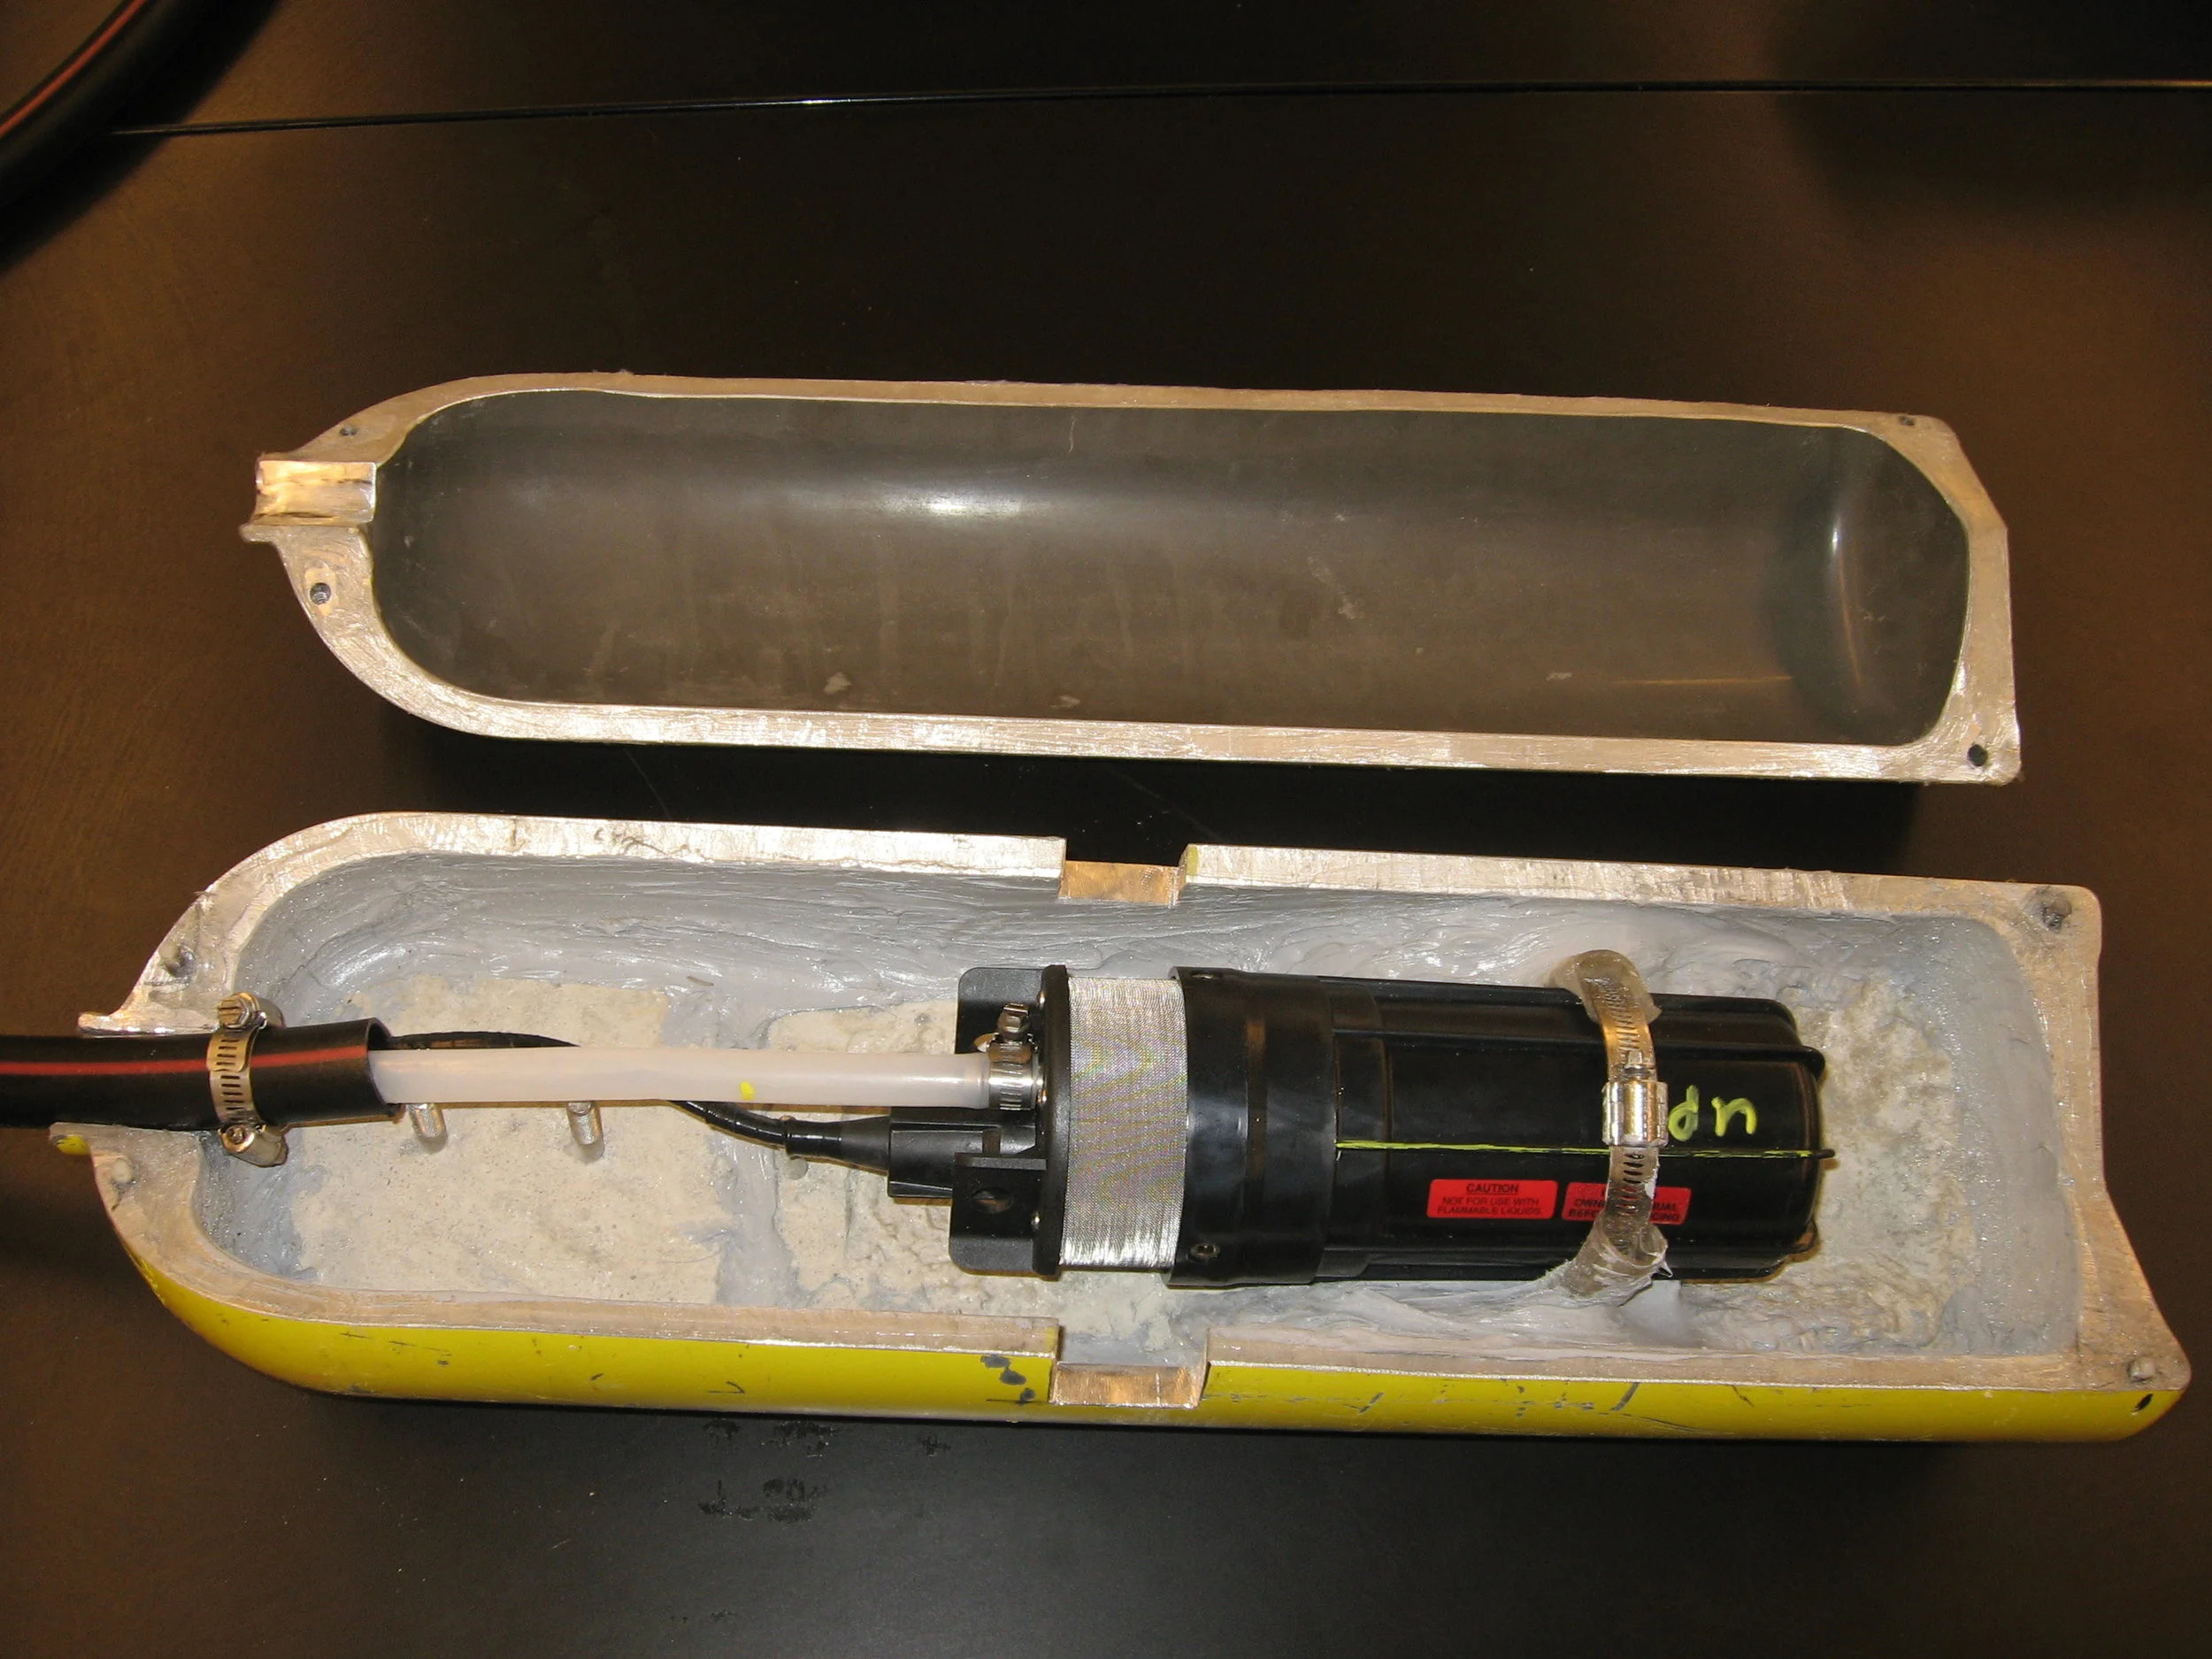
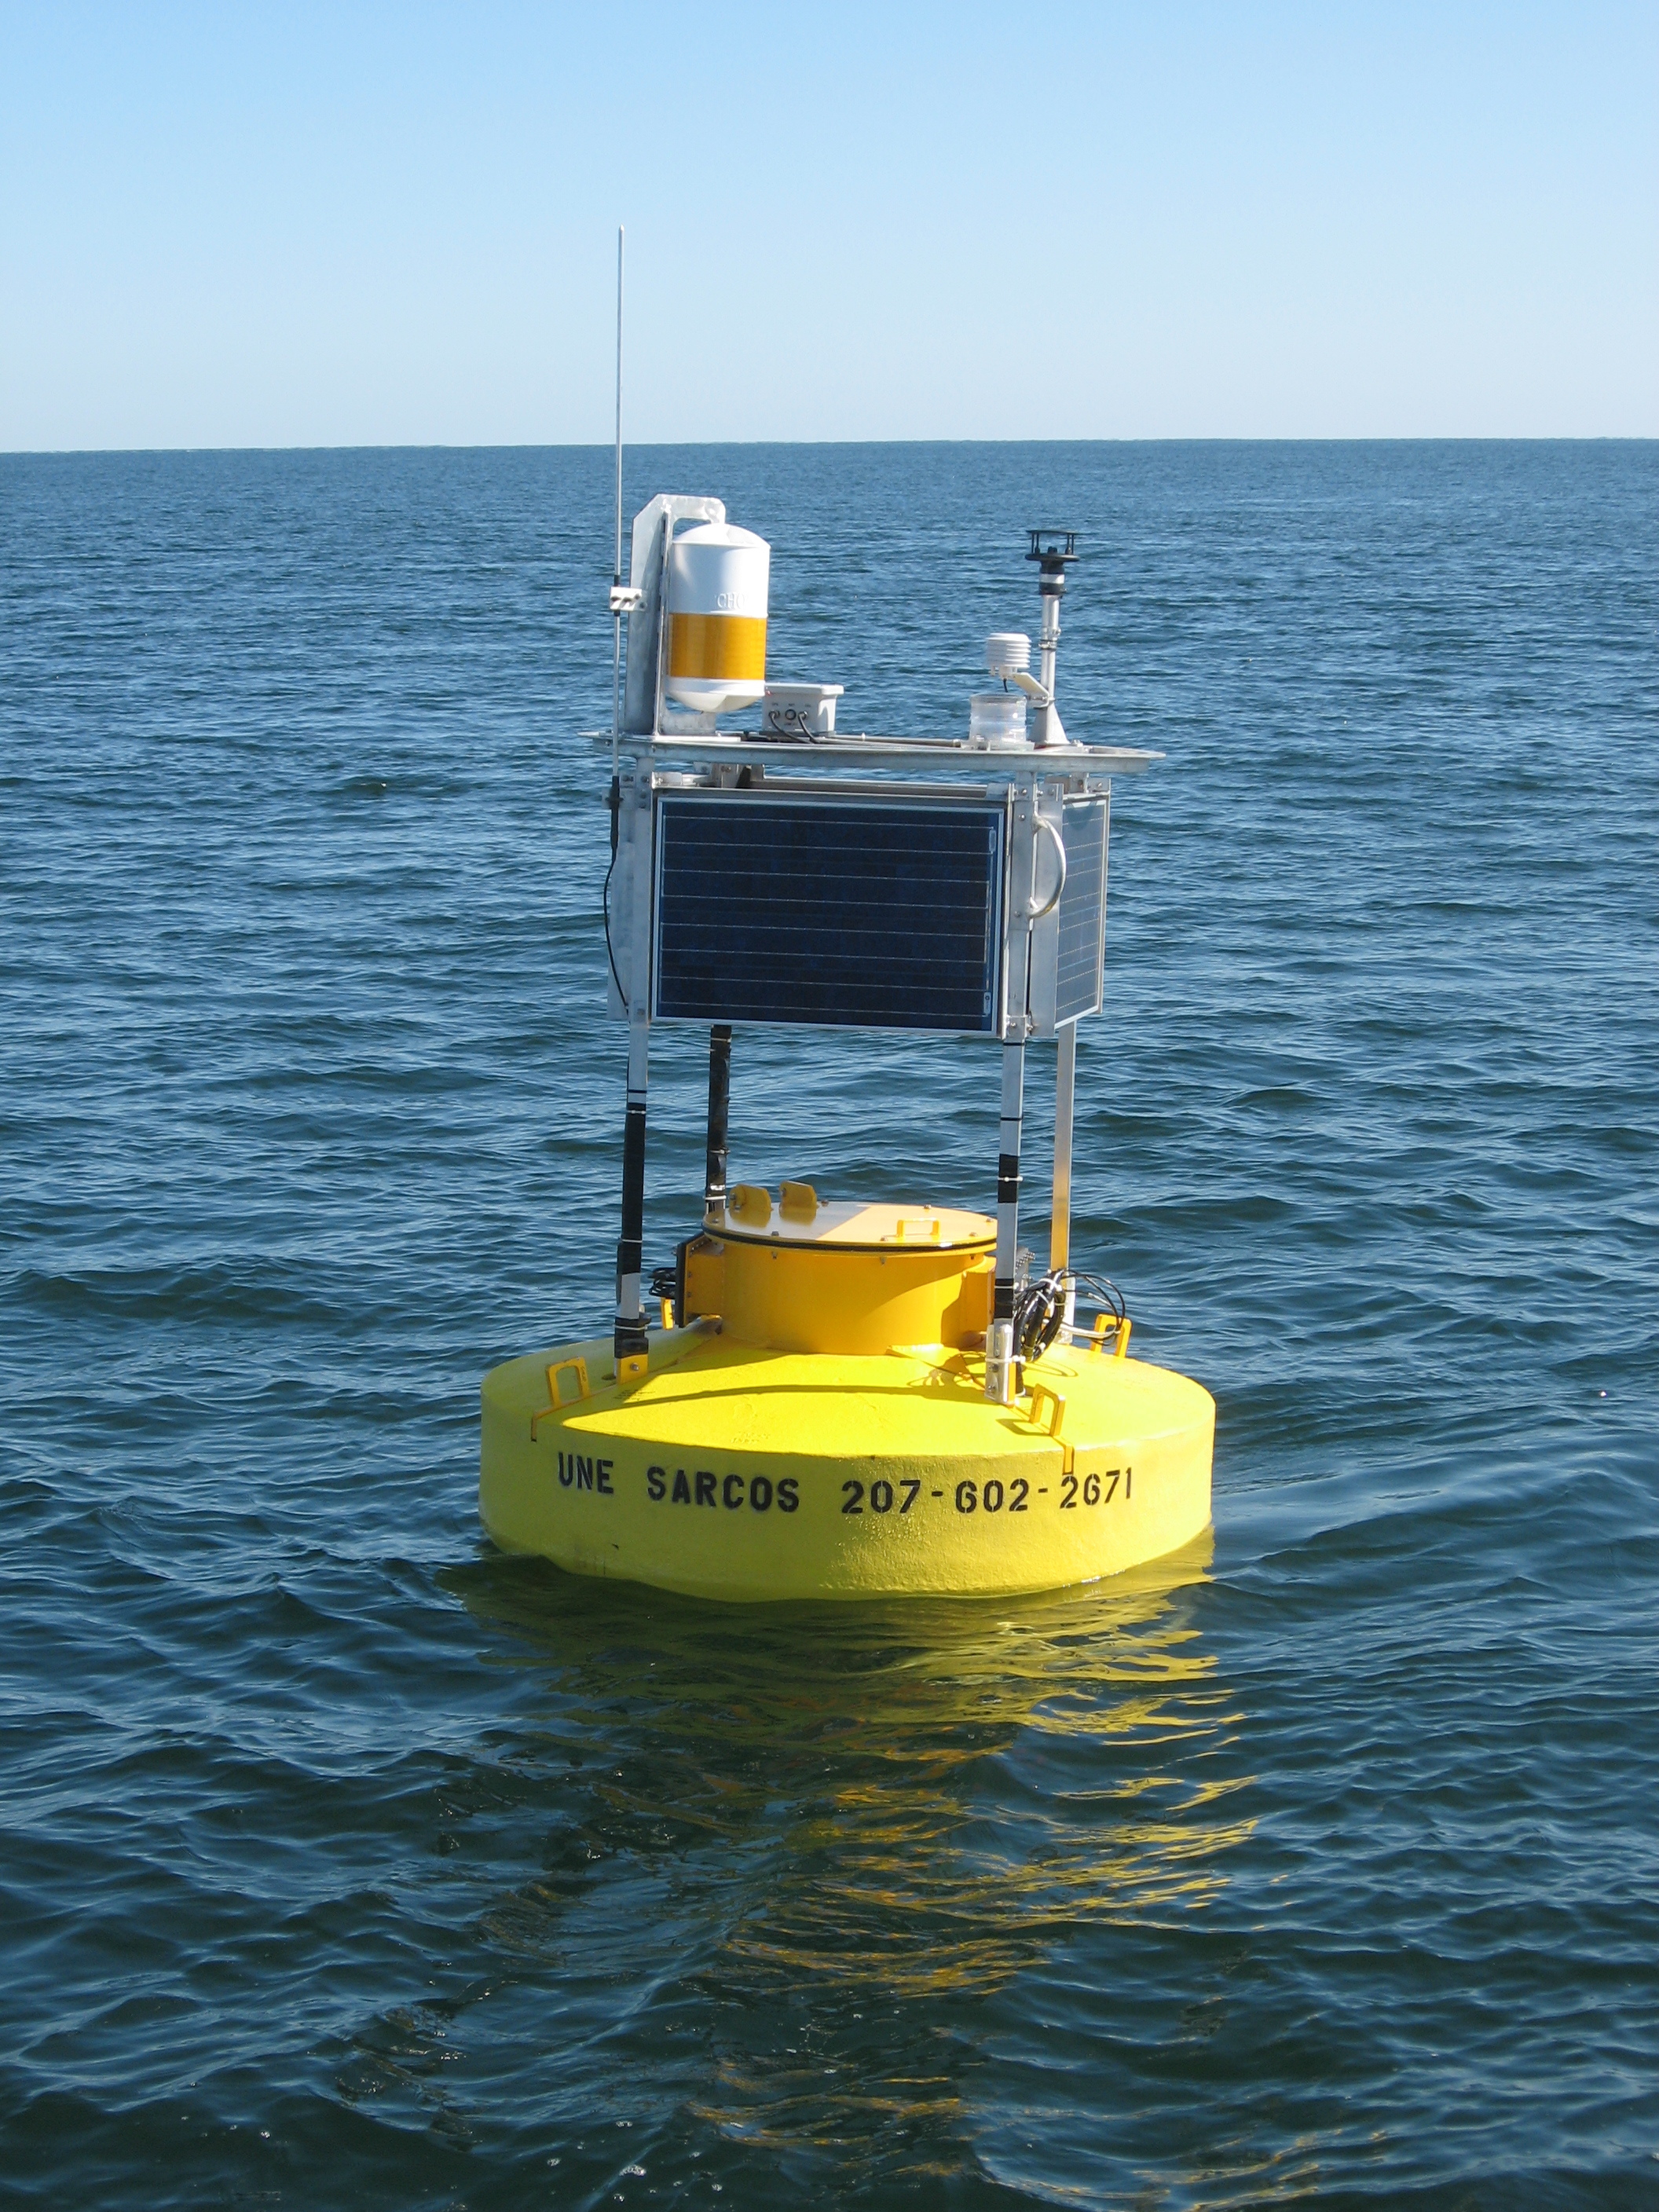
THE SYSTEM'S BUILDING BLOCKS: (clockwise from top left) Buoy during final stages of construction; the datalogger enclosure that resides inside the buoy well; railroad car wheels and chain that anchor the system; the cage and doppler payload suspended immediately below the buoy.
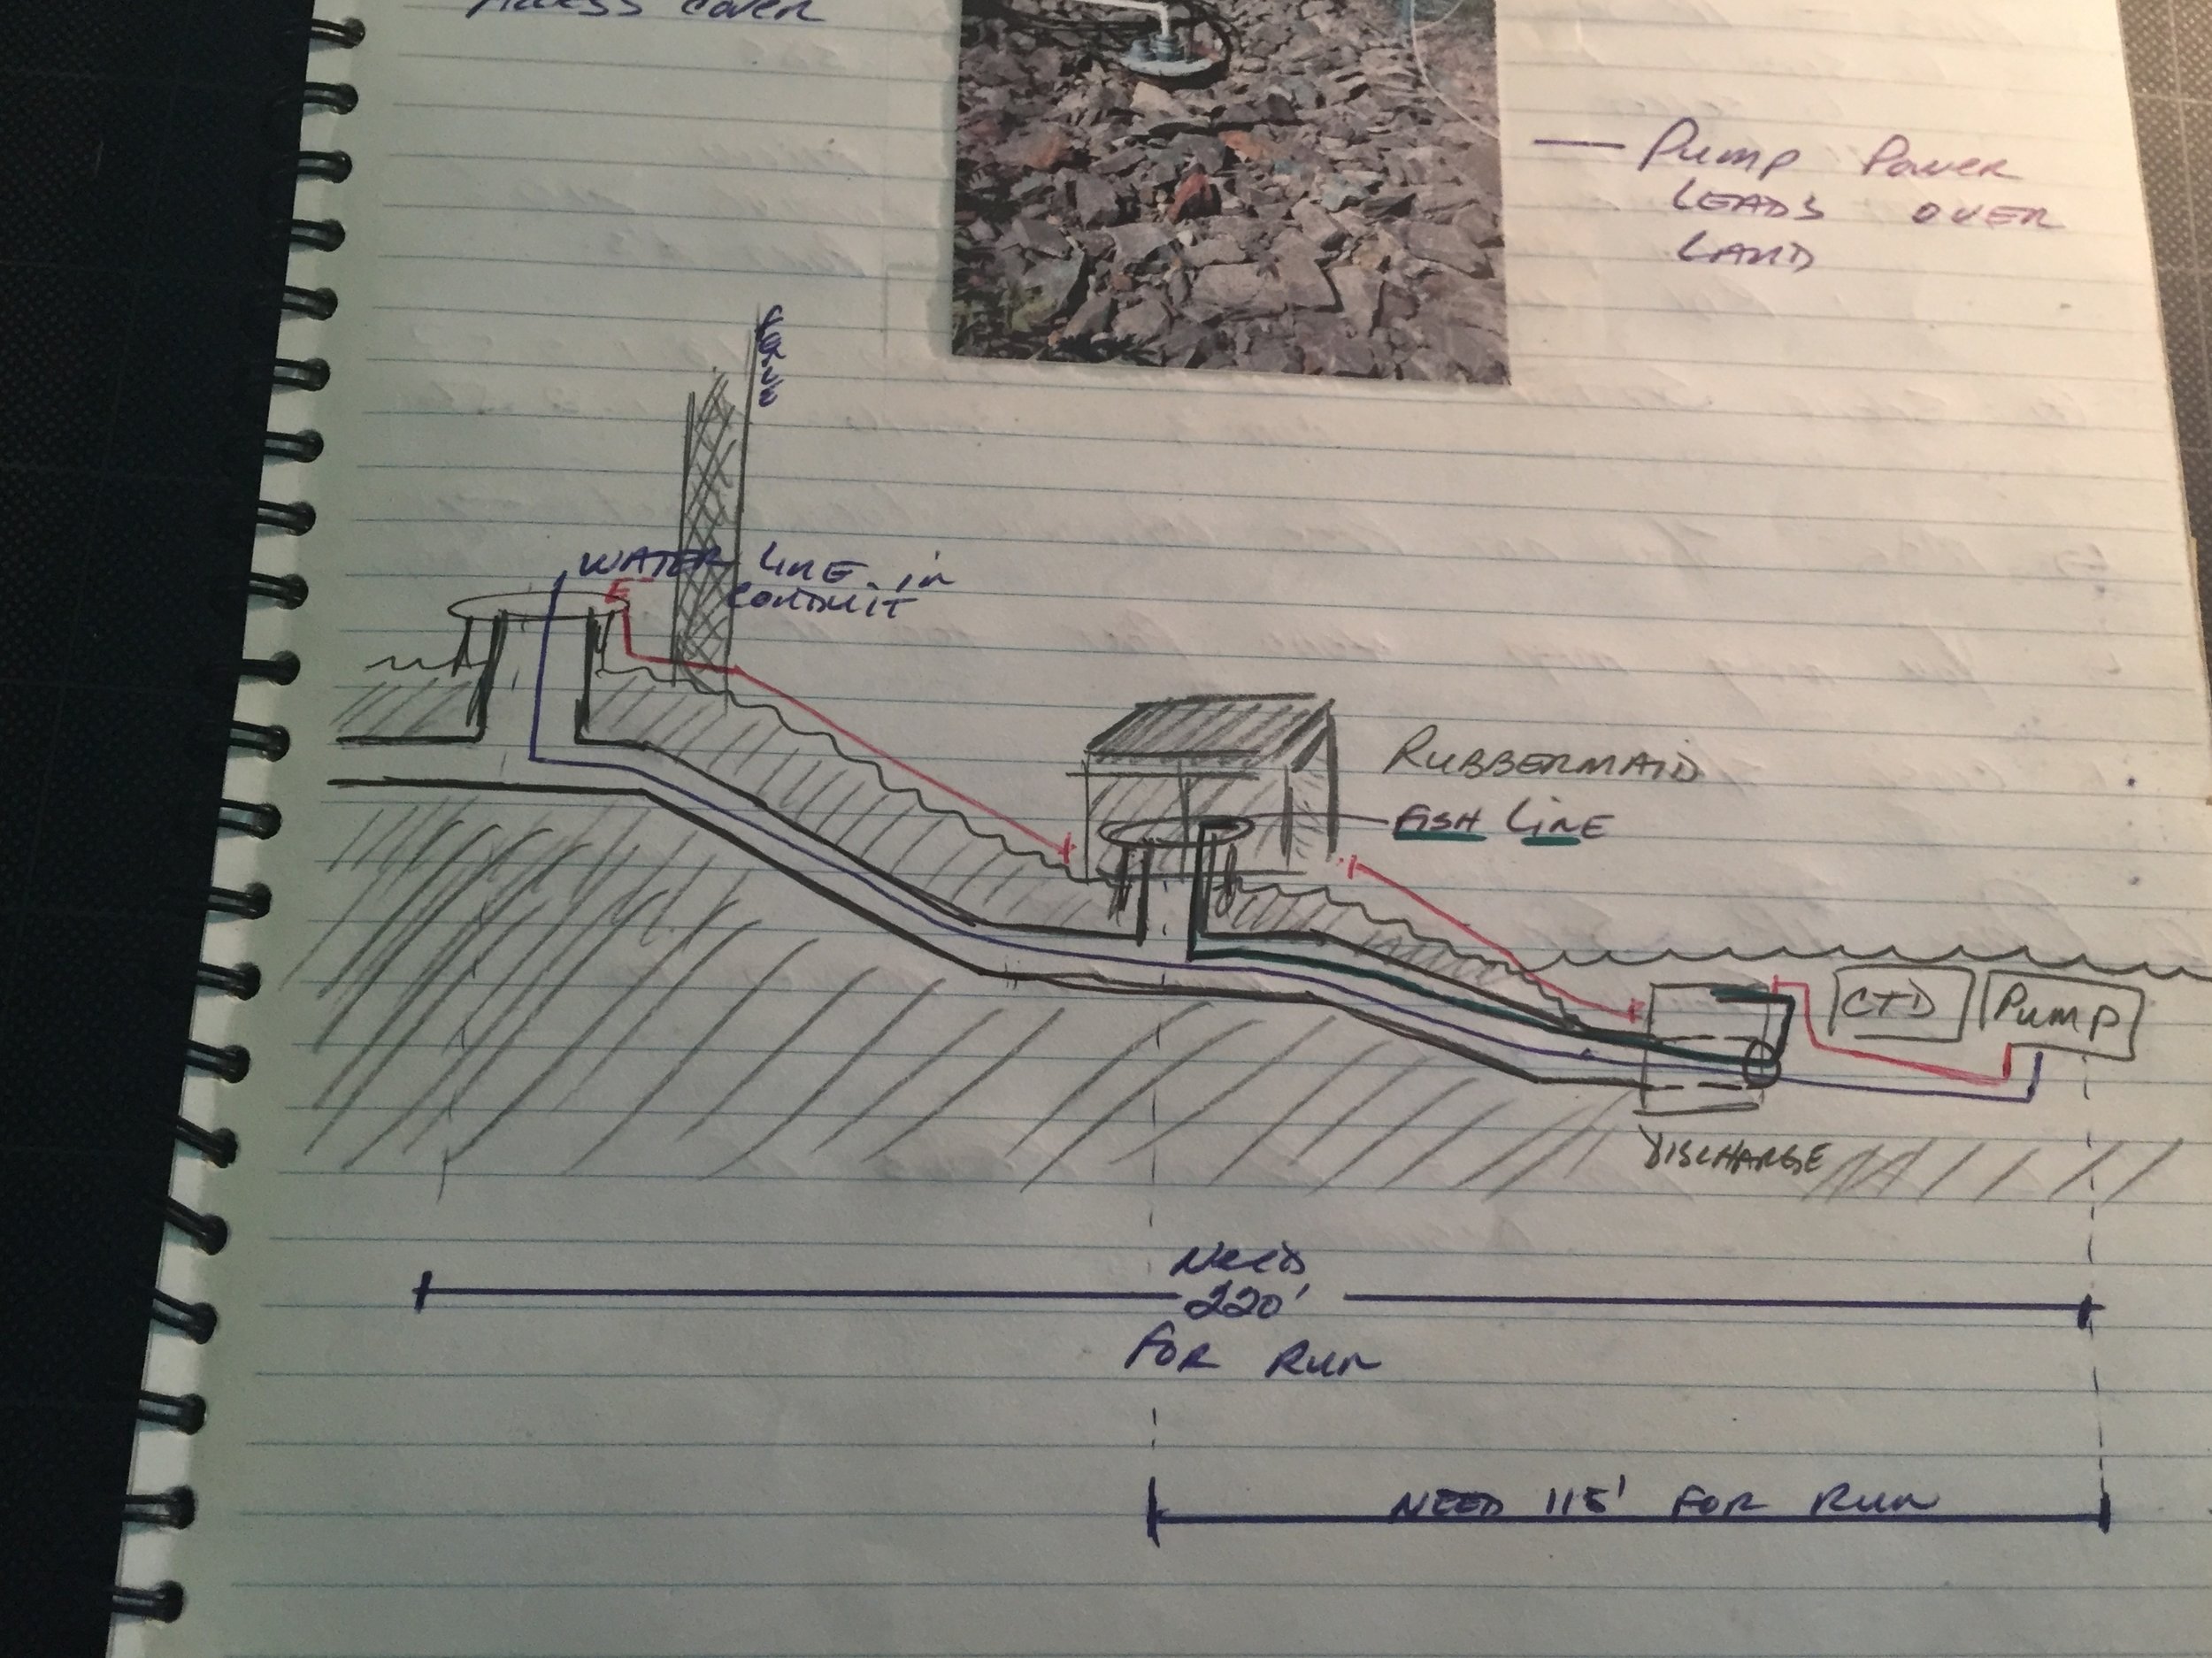
The buoy system was accompanied by a shore station that measured chlorophyll, nutrient concentrations, salinity, temperature and water depth. An acoustic Doppler current profiler was also deployed to measure the horizontal current profile across the river.
Results from this study helped identify different plume dynamics as a result of high and low river discharge. Despite local fishers reporting dead zones, the study did not detect low oxygen levels conducive to those conditions. Data did reveal large mixing events, likely wind driven, able to suppress salinity at depths of 10-20m at the offshore buoy location.
Data from SaRCOS played a critical role for UNE’s SPARTACUS Graduate Fellowship Program, an NSF GK12 project forming linkages among university researchers and their graduate students with the K-12 community.
Assembled, the system weighs over 4000lbs, is almost 200 feet long, and contains almost two dozen instruments and sensors.
The solar powered system supported over a dozen sensor measurements and kept the processing and communications systems running too.
Subsurface instrumentation measured numerous water parameters such as salinity, temperature, depth. Specialized optical sensors called fluorometers measured chlorophyll and dissolved organic mater concentrations. Acoustic technology monitored current flow and direction.
Months of planning and preparation go into the system's configuration, programming, and instrumentation installation. Every piece must work perfectly and is tested for weeks prior to deployment because once it hits the water, it has to work!
It takes roughly 15 weeks of planning and preparation for one deployment day in the field.
After testing, the entire system is broken down and loaded onto a flatbed trailer with a front end loader. The rig is then trailered from UNE to the University of New Hampshire's Newcastle facility where it was loaded onto their flagship research vessel, the 52' R/V Gulf Challenger.
Chained and ready to roll. This would be the sight in the rearview mirror for the next hour.
A jib crane is used to pick and load the buoy and anchor on the the Gulf Challenger which waits almost ten feet below the pier's topside.
Once loaded, the buoy and anchor are secured to the deck of the ship in preparation for the 40 mile transit. It is at this time that all of the chain, cable, and instruments are assembled in preparation for once last system check before leaving the dock.
A buoy system deployment beings by trailing the buoy out behind the boat. This is a team effort requiring significant communication and coordination as the buoy is hoisted over the stern with a hydraulic A-frame and winch system.
The buoy trails in the distance still connected to the boat by the cable and mooring chain. At this time, all instruments are attached and in-tow as well. The anchor is the last piece to go and remains secured until the captain positions the boat on the GPS coordinates.
The anchor hangs clear of the stern as we approach the coordinates. When the captain gives the word, a sharp pull on the rope in hand triggers a quick release, sending the anchor to the ocean floor.
To ensure continuous data collection, a new buoy system with fresh instruments and batteries is deployed before a previously deployed system is recovered. That's the Wood Island Lighthouse in the distance.
Recovering the old system is a bit more challenging in that it is wet, slippery, and often full of sharp critters like mussels and barnacles.
The buoy is the first piece of the system brought on board. You can see all the algae, mussels, and barnacles that grew on the buoy after its approximate eight month deployment.
The instrument cage follows the buoy onboard. All of the black coloration is mussel growth that was so extreme that it eventually caused some of the instrumentation to stop working.
The buoy must be secured before the rest of the system can be recovered. Here, I work quickly to detach the instrument cage while the remaining instruments and cable hang from the block immediately above my head. At this point the anchor is still on the bottom and the boat is moored via the buoy cable.
The CTD outline is barely discernible from the mat of mussels. Hard to believe the bottom instrument looked like the top one only eight months ago.
Fouling adds significant weight to a buoy, causing it to sink slightly and can affect its floating posture.
Upon returning to the UNH dock, the entire process is reversed. The buoy and equipment are offloaded from the boat and secured on the tralier in preparation for the drive home.
The next day, cleaning begins in order to access the instruments' communication ports and recover the high resolution raw data for our research!
Although the buoy transmits live data throughout a deployment, it is very coarse in resolution. It is simply too expensive to telemeter every piece of data actually collected by the system. The true raw data that resides on the instruments and in the datalogger offer much finer detail and consequently is of the most interest and value to the scientists.
A photo I took during one of our cruises was selected for the cover of SeaTechnology Magazine's instrumentation issue. If you scroll a bout half way up this page, you can see the original photo subtitled "on site".
Installing the shore station required that we install all peripheral plumbing and communication cable runs to connect the river-based instruments back to the marine lab.
We used the 12" discharge pipe from the facility's seawater system as a conduit from the river, through the woods, and back to the facility.
The shore station's nutrient sampler required a special high head, low flow pump. A SCUBA tank was repurposed to house the pump and protect if from boats and anchors. The pump had to overcome 60 feet of head as it moved water over 200 liner feet from the river's edge back to the nutrient sampler at the marine lab.
Special mounts and brackets were fabricated to facilitate diver removal and installation of this CTD. Installed adjacent to the nutrient sampler pump, the CTD's inductive modem communications provided live data feeds for salinity, temperature, depth, chlorophyl and dissolved organic matter.